 DGS
DGS Leichte Sprache
MPS Berlin-Spandauer-Schifffahrtskanal
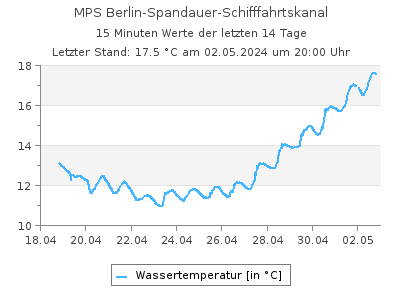
Aktuelle Wassertemperaturen als Tabelle
Letzter Tagesmittelwert (19.06.2025): 21,5 °CWassertemperaturen in °C im Intervall von 2 Stunden (in MEZ), Quelle: Land Berlin
| 00:00 | 02:00 | 04:00 | 06:00 | 08:00 | 10:00 | 12:00 | 14:00 | 16:00 | 18:00 | 20:00 | 22:00 | |
|---|---|---|---|---|---|---|---|---|---|---|---|---|
| 19.07.2025 | 21,1 | 21,1 | - | - | - | - | - | - | - | - | - | - |
| 18.07.2025 | 20,0 | 20,2 | 20,3 | 20,3 | 20,3 | 20,5 | 20,8 | 20,8 | 21,1 | 21,1 | 21,2 | 21,1 |
| 17.07.2025 | 20,1 | 20,4 | 20,5 | 20,5 | 20,6 | 20,6 | 20,6 | 20,6 | 20,6 | 20,6 | 20,3 | 20,0 |
| 16.07.2025 | 21,1 | 21,0 | 20,9 | 20,8 | 20,8 | 20,9 | 21,1 | 21,4 | 21,2 | 20,9 | 19,7 | 19,8 |
| 15.07.2025 | 21,1 | 21,2 | 21,2 | 21,0 | 20,9 | 20,9 | 21,0 | 21,0 | 21,2 | 21,2 | 21,2 | 21,2 |
| 14.07.2025 | 20,7 | 20,6 | 20,5 | 20,5 | 20,6 | 20,8 | 21,1 | 21,5 | 21,4 | 21,3 | 21,2 | 21,1 |
| 13.07.2025 | 19,9 | 20,0 | 19,6 | 19,6 | 19,8 | 20,1 | 20,3 | 20,5 | 20,8 | 20,8 | 20,8 | 20,7 |
| 12.07.2025 | 20,1 | 20,1 | 20,0 | 19,9 | 19,8 | 20,0 | 19,9 | 19,8 | 19,6 | 19,6 | 19,7 | 19,8 |
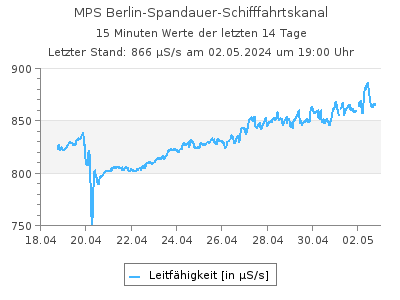
Aktuelle Leitfähigkeit als Tabelle
Letzter Tagesmittelwert (18.06.2025): 1.055 µS/sLeitfähigkeit in µS/s im Intervall von 2 Stunden (in MEZ), Quelle: Land Berlin
| 00:00 | 02:00 | 04:00 | 06:00 | 08:00 | 10:00 | 12:00 | 14:00 | 16:00 | 18:00 | 20:00 | 22:00 | |
|---|---|---|---|---|---|---|---|---|---|---|---|---|
| 19.07.2025 | 888 | 890 | - | - | - | - | - | - | - | - | - | - |
| 18.07.2025 | 766 | 784 | 831 | 851 | 857 | 854 | 855 | 864 | 871 | 874 | 883 | 888 |
| 17.07.2025 | 645 | 755 | 824 | 849 | 868 | 882 | 884 | 889 | 888 | 901 | 849 | 771 |
| 16.07.2025 | 878 | 879 | 877 | 880 | 884 | 884 | 885 | 887 | 867 | 827 | 579 | 586 |
| 15.07.2025 | 882 | 855 | 876 | 896 | 913 | 922 | 920 | 909 | 906 | 896 | 888 | 882 |
| 14.07.2025 | 977 | 984 | 986 | 986 | 977 | 968 | 963 | 962 | 952 | 924 | 907 | 893 |
| 13.07.2025 | 898 | 918 | 862 | 781 | 857 | 936 | 932 | 917 | 943 | 963 | 964 | 963 |
| 12.07.2025 | 929 | 941 | 950 | 957 | 967 | 998 | 1.022 | 998 | 911 | 844 | 844 | 863 |
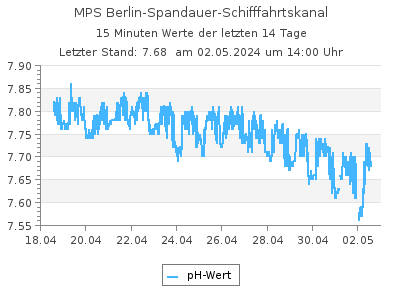
Aktuelle pH-Werte als Tabelle
Letzter Tagesmittelwert (19.06.2025): 7,42pH-Werte im Intervall von 2 Stunden (in MEZ), Quelle: Land Berlin
| 00:00 | 02:00 | 04:00 | 06:00 | 08:00 | 10:00 | 12:00 | 14:00 | 16:00 | 18:00 | 20:00 | 22:00 | |
|---|---|---|---|---|---|---|---|---|---|---|---|---|
| 19.07.2025 | 7,40 | 7,34 | - | - | - | - | - | - | - | - | - | - |
| 18.07.2025 | 7,21 | 7,21 | 7,21 | 7,21 | 7,28 | 7,46 | 7,49 | 7,50 | 7,48 | 7,53 | 7,50 | 7,48 |
| 17.07.2025 | 7,18 | 7,19 | 7,23 | 7,25 | 7,31 | 7,43 | 7,47 | 7,48 | 7,47 | 7,43 | 7,39 | 7,30 |
| 16.07.2025 | 7,33 | 7,29 | 7,29 | 7,33 | 7,41 | 7,51 | 7,53 | 7,55 | 7,54 | 7,48 | 7,29 | 7,21 |
| 15.07.2025 | 7,27 | 7,29 | 7,28 | 7,25 | 7,36 | 7,46 | 7,49 | 7,49 | 7,53 | 7,52 | 7,49 | 7,34 |
| 14.07.2025 | 7,31 | 7,31 | 7,31 | 7,30 | 7,55 | 7,56 | 7,56 | 7,59 | 7,53 | 7,57 | 7,51 | 7,49 |
| 13.07.2025 | 7,34 | 7,31 | 7,30 | 7,29 | 7,33 | 7,60 | 7,63 | 7,59 | 7,60 | 7,58 | 7,50 | 7,36 |
| 12.07.2025 | 7,35 | 7,31 | 7,33 | 7,39 | 7,49 | 7,54 | 7,56 | 7,56 | 7,48 | 7,48 | 7,52 | 7,45 |
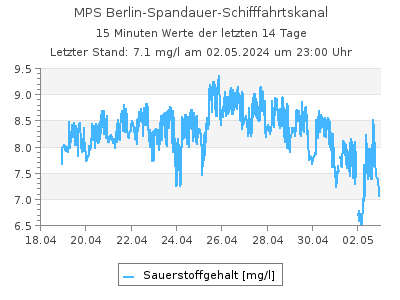
Aktuelle Sauerstoffgehalt-Werte als Tabelle
Letzter Tagesmittelwert (19.06.2025): 4,05 mg/lSauerstoffgehalt-Werte in mg/l im Intervall von 2 Stunden (in MEZ), Quelle: Land Berlin
| 00:00 | 02:00 | 04:00 | 06:00 | 08:00 | 10:00 | 12:00 | 14:00 | 16:00 | 18:00 | 20:00 | 22:00 | |
|---|---|---|---|---|---|---|---|---|---|---|---|---|
| 19.07.2025 | 5,84 | 4,95 | - | - | - | - | - | - | - | - | - | - |
| 18.07.2025 | 0,190 | 1,04 | 0,810 | 1,06 | 3,57 | 6,40 | 6,58 | 6,79 | 6,92 | 7,29 | 7,05 | 6,82 |
| 17.07.2025 | 1,28 | 1,81 | 2,89 | 3,17 | 3,83 | 5,82 | 6,18 | 6,39 | 6,26 | 5,78 | 5,18 | 4,13 |
| 16.07.2025 | 1,72 | 2,44 | 1,75 | 4,35 | 4,93 | 6,50 | 6,88 | 7,13 | 6,83 | 6,42 | 5,21 | 3,72 |
| 15.07.2025 | 0,350 | 1,04 | 1,60 | 0,770 | 3,73 | 6,01 | 6,36 | 6,21 | 6,78 | 6,65 | 6,02 | 1,81 |
| 14.07.2025 | 0,310 | 0,060 | 0,060 | 0,350 | 6,00 | 6,20 | 6,61 | 6,95 | 5,59 | 6,85 | 6,60 | 6,11 |
| 13.07.2025 | 0,510 | 0,600 | 0,060 | 0,060 | 3,73 | 5,94 | 6,35 | 5,88 | 6,09 | 5,78 | 5,10 | 1,51 |
| 12.07.2025 | 1,96 | 0,870 | 1,34 | 2,59 | 5,13 | 6,06 | 5,86 | 5,80 | 4,47 | 4,61 | 4,98 | 4,32 |
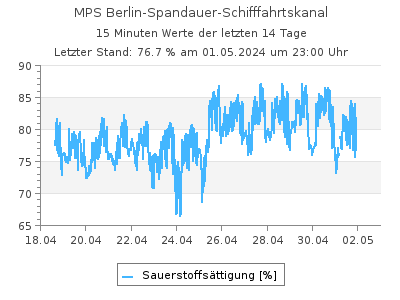
Aktuelle Werte Sauerstoffsättigung als Tabelle
Letzter Tagesmittelwert (17.07.2025): 47,6 %Werte Sauerstoffsättigung in % im Intervall von 2 Stunden (in MEZ), Quelle: Land Berlin
| 00:00 | 02:00 | 04:00 | 06:00 | 08:00 | 10:00 | 12:00 | 14:00 | 16:00 | 18:00 | 20:00 | 22:00 | |
|---|---|---|---|---|---|---|---|---|---|---|---|---|
| 19.07.2025 | - | - | - | - | - | - | - | - | - | - | - | - |
| 18.07.2025 | 2,09 | - | - | - | - | - | - | - | - | - | - | - |
| 17.07.2025 | 14,1 | 20,1 | 32,2 | 35,3 | 42,7 | 64,8 | 68,9 | 71,2 | 69,7 | 64,4 | 57,4 | 45,5 |
| 16.07.2025 | 19,3 | 27,4 | 19,6 | 48,7 | 55,2 | 72,9 | 77,4 | 80,8 | 77,0 | 72,0 | 57,1 | 40,8 |
| 15.07.2025 | 3,94 | 11,7 | 18,0 | 8,65 | 41,9 | 67,4 | 71,5 | 69,7 | 76,4 | 75,0 | 67,9 | 20,4 |
| 14.07.2025 | 3,46 | 0,670 | 0,670 | 3,89 | 66,8 | 69,4 | 74,4 | 78,8 | 63,3 | 77,4 | 74,4 | 68,8 |
| 13.07.2025 | 5,61 | 6,61 | 0,660 | 0,660 | 41,0 | 65,5 | 70,4 | 65,4 | 68,1 | 64,7 | 57,0 | 16,9 |
| 12.07.2025 | 21,7 | 9,60 | 14,8 | 28,5 | 56,3 | 66,7 | 64,4 | 63,6 | 48,9 | 50,4 | 54,5 | 47,4 |
| Messstellennummer | 601 |
|---|---|
| Messstellenname | MPS Berlin-Spandauer-Schifffahrtskanal |
| Gewässer | Berlin-Spandauer-Schifffahrtskanal |
| Betreiber | Land Berlin |
| Messstellenausprägung | Online-Messstelle |
| Flusskilometer | 9.08 |
| Rechtswert (UTM 33 N) | 387757.83 |
| Hochwert (UTM 33 N) | 5822226.26 |
Als Favorit speichern Als Favorit entfernen
Durch die Liste der Wassertemperatur-Messstellen blättern: