 DGS
DGS Leichte Sprache


MPS Berlin-Spandauer-Schifffahrtskanal
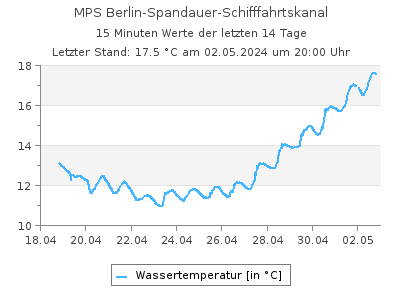
Aktuelle Wassertemperaturen als Tabelle
Letzter Tagesmittelwert (19.06.2025): 21,5 °CWassertemperaturen in °C im Intervall von 2 Stunden (in MEZ), Quelle: Land Berlin
| 00:00 | 02:00 | 04:00 | 06:00 | 08:00 | 10:00 | 12:00 | 14:00 | 16:00 | 18:00 | 20:00 | 22:00 | |
|---|---|---|---|---|---|---|---|---|---|---|---|---|
| 13.07.2025 | 19,9 | 20,0 | 19,6 | 19,6 | 19,8 | 20,1 | - | - | - | - | - | - |
| 12.07.2025 | 20,1 | 20,1 | 20,0 | 19,9 | 19,8 | 20,0 | 19,9 | 19,8 | 19,6 | 19,6 | 19,7 | 19,8 |
| 11.07.2025 | 20,5 | 20,4 | 20,3 | 20,2 | 20,3 | 20,4 | 20,7 | 20,6 | 20,5 | 20,5 | 20,3 | 20,2 |
| 10.07.2025 | 20,7 | 20,6 | 20,5 | 20,4 | 20,4 | 20,6 | 20,8 | 20,7 | 20,8 | 20,7 | 20,7 | 20,6 |
| 09.07.2025 | 21,1 | 21,0 | 20,9 | 20,8 | 20,7 | 20,7 | 20,7 | 20,9 | 20,9 | 20,9 | 20,8 | 20,7 |
| 08.07.2025 | 21,8 | 21,7 | 21,5 | 21,2 | 21,3 | 21,5 | 21,6 | 21,6 | 21,5 | 21,5 | 21,4 | 21,2 |
| 07.07.2025 | 22,3 | 22,1 | 22,1 | 22,0 | 21,9 | 21,9 | 22,1 | 22,3 | 22,4 | 22,1 | 22,0 | 21,9 |
| 06.07.2025 | 22,3 | 22,2 | 22,2 | 22,1 | 22,2 | 22,3 | 22,7 | 23,1 | 22,7 | 22,6 | 22,5 | 22,4 |
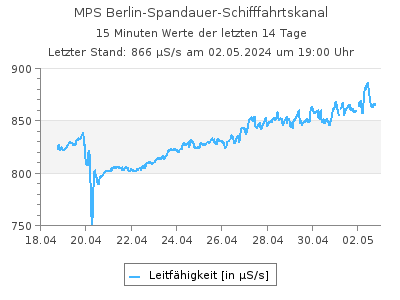
Aktuelle Leitfähigkeit als Tabelle
Letzter Tagesmittelwert (18.06.2025): 1.055 µS/sLeitfähigkeit in µS/s im Intervall von 2 Stunden (in MEZ), Quelle: Land Berlin
| 00:00 | 02:00 | 04:00 | 06:00 | 08:00 | 10:00 | 12:00 | 14:00 | 16:00 | 18:00 | 20:00 | 22:00 | |
|---|---|---|---|---|---|---|---|---|---|---|---|---|
| 13.07.2025 | 898 | 918 | 862 | 781 | 857 | 936 | - | - | - | - | - | - |
| 12.07.2025 | 929 | 941 | 950 | 957 | 967 | 998 | 1.022 | 998 | 911 | 844 | 844 | 863 |
| 11.07.2025 | 1.030 | 1.031 | 1.028 | 1.021 | 1.021 | 1.018 | 1.003 | 987 | 962 | 937 | 924 | 922 |
| 10.07.2025 | 1.073 | 1.078 | 1.079 | 1.078 | 1.076 | 1.073 | 1.069 | 1.060 | 1.048 | 1.045 | 1.041 | 1.034 |
| 09.07.2025 | 1.008 | 1.006 | 1.008 | 1.010 | 1.013 | 1.014 | 1.012 | 1.014 | 1.020 | 1.035 | 1.058 | 1.072 |
| 08.07.2025 | 1.083 | 1.076 | 1.036 | 1.004 | 1.010 | 1.022 | 1.042 | 1.047 | 1.049 | 1.036 | 1.017 | 1.010 |
| 07.07.2025 | 1.066 | 1.066 | 1.066 | 1.065 | 1.059 | 1.053 | 1.050 | 1.052 | 1.058 | 1.064 | 1.067 | 1.081 |
| 06.07.2025 | 1.048 | 1.048 | 1.047 | 1.045 | 1.044 | 1.039 | 1.042 | 1.032 | 1.051 | 1.058 | 1.060 | 1.063 |
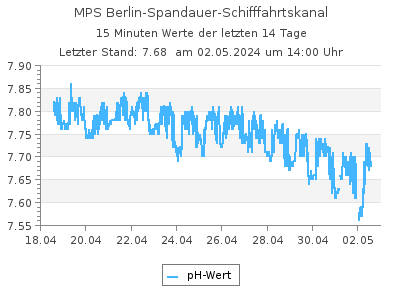
Aktuelle pH-Werte als Tabelle
Letzter Tagesmittelwert (19.06.2025): 7,42pH-Werte im Intervall von 2 Stunden (in MEZ), Quelle: Land Berlin
| 00:00 | 02:00 | 04:00 | 06:00 | 08:00 | 10:00 | 12:00 | 14:00 | 16:00 | 18:00 | 20:00 | 22:00 | |
|---|---|---|---|---|---|---|---|---|---|---|---|---|
| 13.07.2025 | 7,34 | 7,31 | 7,30 | 7,29 | 7,33 | 7,60 | - | - | - | - | - | - |
| 12.07.2025 | 7,35 | 7,31 | 7,33 | 7,39 | 7,49 | 7,54 | 7,56 | 7,56 | 7,48 | 7,48 | 7,52 | 7,45 |
| 11.07.2025 | 7,51 | 7,41 | 7,43 | 7,53 | 7,54 | 7,63 | 7,60 | 7,51 | 7,45 | 7,42 | 7,38 | 7,38 |
| 10.07.2025 | 7,38 | 7,40 | 7,39 | 7,40 | 7,46 | 7,54 | 7,60 | 7,58 | 7,59 | 7,56 | 7,54 | 7,57 |
| 09.07.2025 | 7,31 | 7,32 | 7,31 | 7,32 | 7,35 | 7,38 | 7,43 | 7,46 | 7,43 | 7,49 | 7,48 | 7,50 |
| 08.07.2025 | 7,63 | 7,65 | 7,57 | 7,56 | 7,56 | 7,63 | 7,67 | 7,66 | 7,55 | 7,51 | 7,44 | 7,33 |
| 07.07.2025 | 7,64 | 7,66 | 7,65 | 7,59 | 7,70 | 7,75 | 7,76 | 7,76 | 7,75 | 7,75 | 7,65 | 7,64 |
| 06.07.2025 | 7,64 | 7,59 | 7,58 | 7,57 | 7,57 | 7,75 | 7,78 | 7,91 | 7,81 | 7,80 | 7,75 | 7,68 |
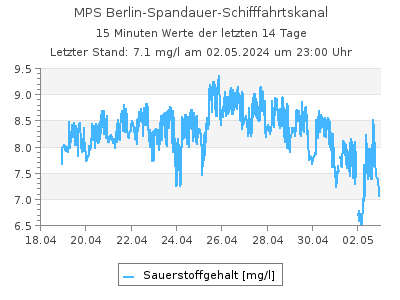
Aktuelle Sauerstoffgehalt-Werte als Tabelle
Letzter Tagesmittelwert (19.06.2025): 4,05 mg/lSauerstoffgehalt-Werte in mg/l im Intervall von 2 Stunden (in MEZ), Quelle: Land Berlin
| 00:00 | 02:00 | 04:00 | 06:00 | 08:00 | 10:00 | 12:00 | 14:00 | 16:00 | 18:00 | 20:00 | 22:00 | |
|---|---|---|---|---|---|---|---|---|---|---|---|---|
| 13.07.2025 | 0,510 | 0,600 | 0,060 | 0,060 | 3,73 | 5,94 | - | - | - | - | - | - |
| 12.07.2025 | 1,96 | 0,870 | 1,34 | 2,59 | 5,13 | 6,06 | 5,86 | 5,80 | 4,47 | 4,61 | 4,98 | 4,32 |
| 11.07.2025 | 4,27 | 1,71 | 2,86 | 5,85 | 5,01 | 6,58 | 6,24 | 5,25 | 4,50 | 4,36 | 4,06 | 4,10 |
| 10.07.2025 | 2,61 | 2,91 | 1,41 | 2,30 | 4,36 | 5,54 | 6,49 | 6,40 | 6,42 | 5,95 | 5,70 | 6,01 |
| 09.07.2025 | 0,770 | 0,970 | 0,490 | 1,23 | 2,57 | 3,26 | 3,52 | 4,19 | 3,92 | 4,68 | 5,00 | 5,45 |
| 08.07.2025 | 6,34 | 6,56 | 5,22 | 5,50 | 5,59 | 6,36 | 6,86 | 6,78 | 5,84 | 4,92 | 3,84 | 1,44 |
| 07.07.2025 | 7,24 | 7,39 | 7,15 | 6,61 | 7,69 | 7,70 | 8,16 | 7,95 | 8,22 | 7,93 | 6,40 | 5,20 |
| 06.07.2025 | 7,23 | 6,77 | 7,31 | 7,21 | 6,53 | 8,10 | 8,46 | 9,92 | 8,65 | 8,54 | 8,03 | 7,57 |
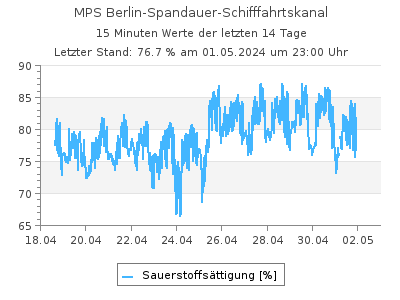
Aktuelle Werte Sauerstoffsättigung als Tabelle
Letzter Tagesmittelwert (12.07.2025): 43,9 %Werte Sauerstoffsättigung in % im Intervall von 2 Stunden (in MEZ), Quelle: Land Berlin
| 00:00 | 02:00 | 04:00 | 06:00 | 08:00 | 10:00 | 12:00 | 14:00 | 16:00 | 18:00 | 20:00 | 22:00 | |
|---|---|---|---|---|---|---|---|---|---|---|---|---|
| 13.07.2025 | 5,61 | - | - | - | - | - | - | - | - | - | - | - |
| 12.07.2025 | 21,7 | 9,60 | 14,8 | 28,5 | 56,3 | 66,7 | 64,4 | 63,6 | 48,9 | 50,4 | 54,5 | 47,4 |
| 11.07.2025 | 47,5 | 19,0 | 31,7 | 64,7 | 55,6 | 73,0 | 69,7 | 58,5 | 50,1 | 48,5 | 45,0 | 45,4 |
| 10.07.2025 | 29,2 | 32,4 | 15,7 | 25,5 | 48,4 | 61,7 | 72,6 | 71,5 | 71,8 | 66,5 | 63,6 | 66,9 |
| 09.07.2025 | 8,67 | 10,9 | 5,49 | 13,8 | 28,7 | 36,4 | 39,3 | 47,0 | 43,9 | 52,4 | 56,0 | 60,9 |
| 08.07.2025 | 72,4 | 74,7 | 59,2 | 62,1 | 63,1 | 72,2 | 78,0 | 77,1 | 66,3 | 55,8 | 43,4 | 16,2 |
| 07.07.2025 | 83,4 | 84,9 | 82,0 | 75,7 | 88,0 | 88,1 | 93,7 | 91,5 | 94,9 | 91,0 | 73,3 | 59,5 |
| 06.07.2025 | 83,3 | 77,9 | 84,0 | 82,8 | 75,0 | 93,2 | 98,2 | 116 | 100 | 98,9 | 92,8 | 87,3 |
| Messstellennummer | 601 |
|---|---|
| Messstellenname | MPS Berlin-Spandauer-Schifffahrtskanal |
| Gewässer | Berlin-Spandauer-Schifffahrtskanal |
| Betreiber | Land Berlin |
| Messstellenausprägung | Online-Messstelle |
| Flusskilometer | 9.08 |
| Rechtswert (UTM 33 N) | 387757.83 |
| Hochwert (UTM 33 N) | 5822226.26 |
Als Favorit speichern Als Favorit entfernen
Durch die Liste der Wasserqualität-Messstellen blättern: