 DGS
DGS Leichte Sprache


MPS Neuköllner Schifffahrtskanal
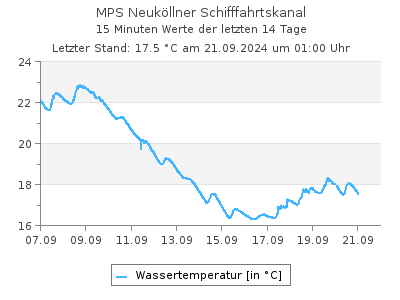
Aktuelle Wassertemperaturen als Tabelle
Letzter Tagesmittelwert (19.06.2025): 22,1 °CWassertemperaturen in °C im Intervall von 2 Stunden (in MEZ), Quelle: Land Berlin
| 00:00 | 02:00 | 04:00 | 06:00 | 08:00 | 10:00 | 12:00 | 14:00 | 16:00 | 18:00 | 20:00 | 22:00 | |
|---|---|---|---|---|---|---|---|---|---|---|---|---|
| 30.06.2025 | - | 22,4 | 22,1 | 22,0 | 21,9 | 22,2 | 22,7 | 23,1 | 23,5 | 23,4 | 23,3 | - |
| 29.06.2025 | 22,6 | 22,5 | 22,4 | 22,3 | 22,3 | 22,6 | 22,8 | 23,1 | 23,5 | 23,4 | 23,2 | 22,9 |
| 28.06.2025 | 21,5 | 21,4 | 21,2 | 21,1 | 21,1 | 21,3 | 22,2 | 22,7 | 22,9 | 22,8 | 22,6 | 22,7 |
| 27.06.2025 | 22,1 | 21,9 | 21,9 | 21,8 | 21,7 | 21,8 | 21,8 | 22,0 | 21,8 | 21,8 | 21,7 | 21,6 |
| 26.06.2025 | 21,5 | 21,4 | 21,3 | 21,2 | 21,2 | 21,4 | 21,9 | 22,0 | 22,3 | 22,6 | 22,5 | 22,4 |
| 25.06.2025 | 21,5 | 21,4 | 21,3 | 21,2 | 21,2 | 21,2 | 21,5 | 21,5 | 21,7 | 21,7 | 21,6 | 21,6 |
| 24.06.2025 | 22,4 | 22,2 | 21,9 | 21,8 | 21,6 | 21,8 | 21,7 | 21,8 | 21,9 | 21,7 | 21,7 | 21,6 |
| 23.06.2025 | 24,1 | 23,9 | 23,7 | 23,3 | 23,1 | 23,5 | 23,6 | 23,6 | 23,4 | 23,0 | 22,8 | 22,6 |
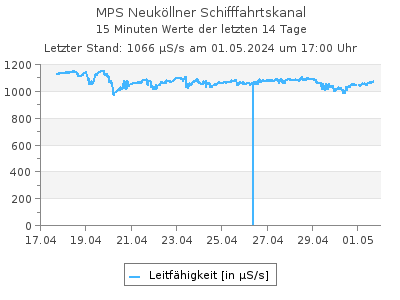
Aktuelle Leitfähigkeit als Tabelle
Letzter Tagesmittelwert (19.06.2025): 1.012 µS/sLeitfähigkeit in µS/s im Intervall von 2 Stunden (in MEZ), Quelle: Land Berlin
| 00:00 | 02:00 | 04:00 | 06:00 | 08:00 | 10:00 | 12:00 | 14:00 | 16:00 | 18:00 | 20:00 | 22:00 | |
|---|---|---|---|---|---|---|---|---|---|---|---|---|
| 30.06.2025 | - | 1.084 | 1.084 | 1.085 | 1.088 | 1.092 | 1.087 | 1.086 | 1.079 | 1.078 | 1.059 | - |
| 29.06.2025 | 1.048 | 1.056 | 1.068 | 1.075 | 1.081 | 1.081 | 1.065 | 1.060 | 1.043 | 1.043 | 1.058 | 1.072 |
| 28.06.2025 | 1.124 | 1.128 | 1.129 | 1.133 | 1.135 | 1.138 | 1.105 | 1.100 | 1.102 | 1.104 | 1.104 | 1.072 |
| 27.06.2025 | 1.093 | 1.083 | 1.087 | 1.089 | 1.092 | 1.067 | 1.076 | 1.100 | 1.085 | 1.101 | 1.114 | 1.118 |
| 26.06.2025 | 1.041 | 1.051 | 1.058 | 1.059 | 1.060 | 1.058 | 1.080 | 1.078 | 1.082 | 1.084 | 1.101 | 1.109 |
| 25.06.2025 | 1.087 | 1.092 | 1.093 | 1.092 | 1.092 | 1.095 | 1.053 | 991 | 1.014 | 993 | 978 | 1.017 |
| 24.06.2025 | 1.072 | 1.073 | 1.074 | 1.076 | 1.075 | 1.079 | 1.076 | 1.075 | 1.078 | 1.048 | 1.065 | 1.077 |
| 23.06.2025 | 1.058 | 1.065 | 1.062 | 1.037 | 1.040 | 1.030 | 1.014 | 1.011 | 1.034 | 1.056 | 1.063 | 1.068 |
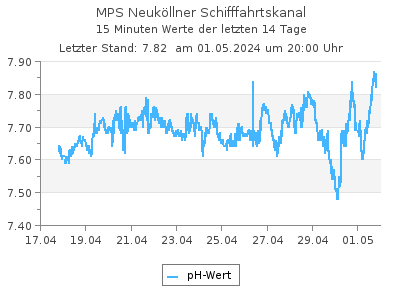
Aktuelle pH-Werte als Tabelle
Letzter Tagesmittelwert (19.06.2025): 8,23pH-Werte im Intervall von 2 Stunden (in MEZ), Quelle: Land Berlin
| 00:00 | 02:00 | 04:00 | 06:00 | 08:00 | 10:00 | 12:00 | 14:00 | 16:00 | 18:00 | 20:00 | 22:00 | |
|---|---|---|---|---|---|---|---|---|---|---|---|---|
| 30.06.2025 | - | 7,74 | 7,66 | 7,80 | 7,69 | 7,73 | 7,82 | 7,98 | 7,81 | 7,86 | 7,95 | - |
| 29.06.2025 | 7,67 | 7,68 | 7,70 | 7,65 | 7,66 | 7,64 | 7,79 | 7,90 | 7,88 | 7,83 | 7,84 | 7,74 |
| 28.06.2025 | 7,63 | 7,62 | 7,62 | 7,62 | 7,71 | 7,64 | 7,73 | 7,75 | 7,75 | 7,80 | 7,74 | 7,69 |
| 27.06.2025 | 7,60 | 7,58 | 7,58 | 7,58 | 7,61 | 7,60 | 7,66 | 7,82 | 7,72 | 7,75 | 7,71 | 7,65 |
| 26.06.2025 | 7,51 | 7,52 | 7,53 | 7,62 | 7,54 | 7,53 | 7,59 | 7,57 | 7,56 | 7,68 | 7,59 | 7,60 |
| 25.06.2025 | 8,00 | 7,88 | 7,83 | 7,79 | 7,95 | 7,99 | 8,02 | 7,67 | 7,62 | 7,54 | 7,50 | 7,49 |
| 24.06.2025 | 7,93 | 7,89 | 7,84 | 7,85 | 7,91 | 7,97 | 8,18 | 8,13 | 8,11 | 8,16 | 8,09 | 8,02 |
| 23.06.2025 | 8,05 | 7,90 | 7,91 | 8,02 | 7,89 | 8,03 | 8,15 | 8,37 | 8,40 | 8,24 | 8,21 | 8,04 |
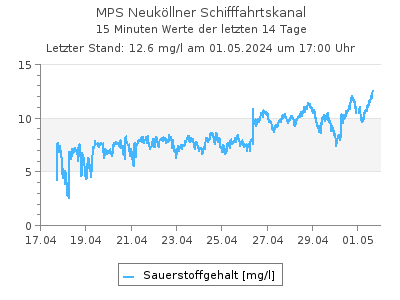
Aktuelle Sauerstoffgehalt-Werte als Tabelle
Letzter Tagesmittelwert (19.06.2025): 10,4 mg/lSauerstoffgehalt-Werte in mg/l im Intervall von 2 Stunden (in MEZ), Quelle: Land Berlin
| 00:00 | 02:00 | 04:00 | 06:00 | 08:00 | 10:00 | 12:00 | 14:00 | 16:00 | 18:00 | 20:00 | 22:00 | |
|---|---|---|---|---|---|---|---|---|---|---|---|---|
| 30.06.2025 | - | 1,44 | 0,090 | 3,90 | 0,320 | 4,24 | 2,06 | 5,43 | 3,52 | 2,73 | 1,71 | - |
| 29.06.2025 | 0,280 | 0,300 | 1,08 | 0,120 | 1,64 | 0,330 | 4,98 | 5,47 | 4,77 | 2,13 | 3,34 | 0,910 |
| 28.06.2025 | 0,930 | 0,060 | 0,180 | 0,060 | 2,26 | 0,090 | 0,960 | 3,67 | 1,98 | 4,27 | 3,03 | 0,400 |
| 27.06.2025 | 0,600 | 0,460 | 0,720 | 0,230 | 0,830 | 1,46 | 3,34 | 4,83 | 3,14 | 3,53 | 3,45 | 1,25 |
| 26.06.2025 | 0,370 | 0,270 | 0,110 | 2,95 | 0,220 | 0,060 | 2,48 | 1,90 | 0,750 | 4,08 | 1,32 | 1,30 |
| 25.06.2025 | 6,88 | 6,21 | 5,94 | 6,10 | 8,72 | 6,49 | 6,03 | 3,48 | 2,56 | 1,28 | 0,350 | 0,490 |
| 24.06.2025 | 8,31 | 8,05 | 7,80 | 4,95 | 9,49 | 8,29 | 10,8 | 8,89 | 10,0 | 6,94 | 9,91 | 7,73 |
| 23.06.2025 | 13,7 | 11,0 | 7,38 | 14,8 | 6,72 | 11,8 | 11,3 | 13,6 | 13,9 | 11,8 | 12,5 | 9,69 |
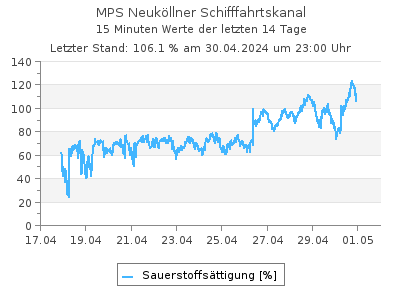
Aktuelle Werte Sauerstoffsättigung als Tabelle
Letzter Tagesmittelwert (28.06.2025): 17,4 %Werte Sauerstoffsättigung in % im Intervall von 2 Stunden (in MEZ), Quelle: Land Berlin
| 00:00 | 02:00 | 04:00 | 06:00 | 08:00 | 10:00 | 12:00 | 14:00 | 16:00 | 18:00 | 20:00 | 22:00 | |
|---|---|---|---|---|---|---|---|---|---|---|---|---|
| 30.06.2025 | - | - | - | - | - | - | - | - | - | - | - | - |
| 29.06.2025 | 3,25 | 3,47 | 12,5 | 1,38 | 18,9 | 3,82 | 57,9 | 63,9 | 56,2 | 25,1 | 39,1 | 10,6 |
| 28.06.2025 | 10,5 | 0,680 | 2,03 | 0,680 | 25,4 | 1,02 | 11,0 | 42,6 | 23,1 | 49,7 | 35,1 | 4,64 |
| 27.06.2025 | 6,88 | 5,26 | 8,22 | 2,62 | 9,46 | 16,7 | 38,1 | 55,4 | 35,9 | 40,3 | 39,3 | 14,2 |
| 26.06.2025 | 4,20 | 3,06 | 1,24 | 33,3 | 2,48 | 0,680 | 28,3 | 21,8 | 8,63 | 47,2 | 15,3 | 15,0 |
| 25.06.2025 | 78,1 | 70,3 | 67,1 | 68,8 | 98,2 | 73,2 | 68,5 | 39,5 | 29,1 | 14,6 | 3,98 | 5,57 |
| 24.06.2025 | 95,9 | 92,5 | 89,2 | 56,4 | 108 | 94,5 | 123 | 101 | 115 | 79,1 | 113 | 87,8 |
| 23.06.2025 | 163 | 131 | 87,3 | 173 | 78,5 | 139 | 133 | 161 | 164 | 138 | 145 | 112 |
| Messstellennummer | 504 |
|---|---|
| Messstellenname | MPS Neuköllner Schifffahrtskanal |
| Gewässer | Neuköllner Schifffahrtskanal |
| Betreiber | Land Berlin |
| Messstellenausprägung | Online-Messstelle |
| Flusskilometer | 0.73 |
| Rechtswert (UTM 33 N) | 394374.64 |
| Hochwert (UTM 33 N) | 5816093.86 |
Als Favorit speichern Als Favorit entfernen
Durch die Liste der Durchfluss-Messstellen blättern: