 DGS
DGS Leichte Sprache
MPS Neuköllner Schifffahrtskanal
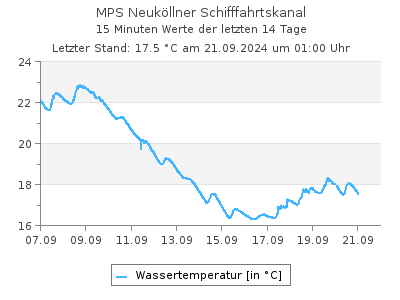
Aktuelle Wassertemperaturen als Tabelle
Letzter Tagesmittelwert (19.06.2025): 22,1 °CWassertemperaturen in °C im Intervall von 2 Stunden (in MEZ), Quelle: Land Berlin
| 00:00 | 02:00 | 04:00 | 06:00 | 08:00 | 10:00 | 12:00 | 14:00 | 16:00 | 18:00 | 20:00 | 22:00 | |
|---|---|---|---|---|---|---|---|---|---|---|---|---|
| 12.07.2025 | 20,6 | 20,5 | 20,4 | 20,3 | 20,2 | - | - | - | - | - | - | - |
| 11.07.2025 | 20,8 | 20,7 | 20,6 | 20,5 | 20,5 | 20,6 | 20,9 | 21,1 | 21,1 | 21,0 | 20,8 | 20,7 |
| 10.07.2025 | 21,2 | 21,0 | 20,9 | 20,8 | 20,8 | 21,1 | 21,6 | 21,2 | 21,3 | 20,8 | 20,8 | 20,8 |
| 09.07.2025 | 21,9 | 21,7 | 21,6 | 21,4 | 21,4 | 21,3 | 21,3 | 21,5 | 21,6 | 21,6 | 21,4 | 21,3 |
| 08.07.2025 | 22,5 | 22,3 | 22,2 | 22,0 | 21,9 | 22,0 | 22,2 | 22,3 | 22,4 | 22,3 | 22,1 | 22,0 |
| 07.07.2025 | 23,0 | 22,8 | 22,6 | 22,5 | 22,4 | 22,4 | 22,5 | 22,6 | 23,1 | 23,1 | 22,9 | 22,7 |
| 06.07.2025 | 22,9 | 22,8 | 22,6 | 22,5 | 22,6 | 22,7 | 23,2 | 23,5 | 23,5 | 23,5 | 23,3 | 23,1 |
| 05.07.2025 | 23,1 | 22,9 | 22,7 | 22,5 | 22,4 | 22,5 | 22,8 | 23,6 | 23,6 | 23,3 | 23,2 | 23,0 |
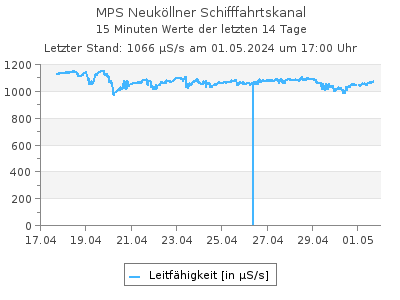
Aktuelle Leitfähigkeit als Tabelle
Letzter Tagesmittelwert (19.06.2025): 1.012 µS/sLeitfähigkeit in µS/s im Intervall von 2 Stunden (in MEZ), Quelle: Land Berlin
| 00:00 | 02:00 | 04:00 | 06:00 | 08:00 | 10:00 | 12:00 | 14:00 | 16:00 | 18:00 | 20:00 | 22:00 | |
|---|---|---|---|---|---|---|---|---|---|---|---|---|
| 12.07.2025 | 1.202 | 1.203 | 1.207 | 1.207 | 1.206 | - | - | - | - | - | - | - |
| 11.07.2025 | 1.146 | 1.157 | 1.163 | 1.170 | 1.181 | 1.187 | 1.152 | 1.156 | 1.172 | 1.175 | 1.193 | 1.206 |
| 10.07.2025 | 1.191 | 1.166 | 1.195 | 1.195 | 1.197 | 1.185 | 1.152 | 1.176 | 1.192 | 1.042 | 1.077 | 1.105 |
| 09.07.2025 | 1.168 | 1.170 | 1.170 | 1.165 | 1.166 | 1.166 | 1.169 | 1.167 | 1.154 | 1.166 | 1.177 | 1.185 |
| 08.07.2025 | 1.146 | 1.159 | 1.165 | 1.171 | 1.174 | 1.176 | 1.140 | 1.121 | 1.112 | 1.096 | 1.108 | 1.157 |
| 07.07.2025 | 1.135 | 1.144 | 1.150 | 1.155 | 1.154 | 1.159 | 1.155 | 1.158 | 1.159 | 1.112 | 1.117 | 1.133 |
| 06.07.2025 | 1.139 | 1.140 | 1.136 | 1.138 | 1.141 | 1.144 | 1.139 | 1.129 | 1.128 | 1.112 | 1.118 | 1.126 |
| 05.07.2025 | 1.103 | 1.122 | 1.128 | 1.127 | 1.129 | 1.125 | 1.123 | 1.116 | 1.115 | 1.107 | 1.110 | 1.135 |
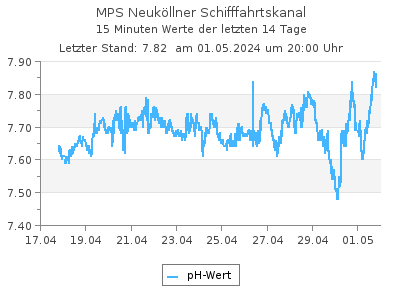
Aktuelle pH-Werte als Tabelle
Letzter Tagesmittelwert (19.06.2025): 8,23pH-Werte im Intervall von 2 Stunden (in MEZ), Quelle: Land Berlin
| 00:00 | 02:00 | 04:00 | 06:00 | 08:00 | 10:00 | 12:00 | 14:00 | 16:00 | 18:00 | 20:00 | 22:00 | |
|---|---|---|---|---|---|---|---|---|---|---|---|---|
| 12.07.2025 | 7,79 | 7,76 | 7,75 | 7,76 | 7,76 | - | - | - | - | - | - | - |
| 11.07.2025 | 7,75 | 7,76 | 7,76 | 7,75 | 7,75 | 7,76 | 7,79 | 7,87 | 7,85 | 7,88 | 7,78 | 7,79 |
| 10.07.2025 | 7,83 | 7,85 | 7,82 | 7,83 | 7,82 | 7,90 | 8,10 | 8,03 | 7,82 | 7,76 | 7,76 | 7,75 |
| 09.07.2025 | 7,86 | 7,87 | 7,82 | 7,82 | 7,84 | 7,90 | 7,84 | 8,00 | 8,10 | 8,11 | 7,93 | 7,97 |
| 08.07.2025 | 8,14 | 7,95 | 7,86 | 7,83 | 7,81 | 7,82 | 7,96 | 8,10 | 8,22 | 8,36 | 8,15 | 8,00 |
| 07.07.2025 | 8,20 | 8,10 | 8,01 | 7,94 | 7,96 | 7,94 | 8,04 | 7,98 | 8,04 | 8,20 | 8,26 | 8,28 |
| 06.07.2025 | 8,05 | 8,04 | 8,07 | 8,07 | 7,90 | 7,94 | 8,33 | 8,42 | 8,57 | 8,56 | 8,54 | 8,32 |
| 05.07.2025 | 8,08 | 8,00 | 7,99 | 7,91 | 7,94 | 7,94 | 8,12 | 8,28 | 8,40 | 8,47 | 8,41 | 8,14 |
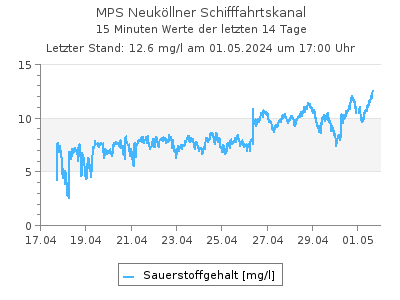
Aktuelle Sauerstoffgehalt-Werte als Tabelle
Letzter Tagesmittelwert (19.06.2025): 10,4 mg/lSauerstoffgehalt-Werte in mg/l im Intervall von 2 Stunden (in MEZ), Quelle: Land Berlin
| 00:00 | 02:00 | 04:00 | 06:00 | 08:00 | 10:00 | 12:00 | 14:00 | 16:00 | 18:00 | 20:00 | 22:00 | |
|---|---|---|---|---|---|---|---|---|---|---|---|---|
| 12.07.2025 | 0,190 | 0,060 | 0,080 | 0,080 | 0,100 | - | - | - | - | - | - | - |
| 11.07.2025 | - | 0,080 | 0,080 | 0,070 | 0,080 | 0,080 | 1,37 | 2,33 | 1,28 | 1,40 | 0,160 | 0,330 |
| 10.07.2025 | 1,90 | 1,14 | 1,46 | 1,94 | 1,45 | 0,370 | 6,13 | 4,75 | 0,400 | 0,950 | 0,170 | 0,080 |
| 09.07.2025 | 2,33 | 2,19 | 1,01 | 1,60 | 2,08 | 3,47 | 2,33 | 5,02 | 5,93 | 6,16 | 2,54 | 3,81 |
| 08.07.2025 | 5,09 | 3,61 | 2,61 | 1,20 | 1,98 | 1,34 | 4,00 | 6,70 | 6,96 | 8,95 | 5,92 | 4,20 |
| 07.07.2025 | 6,91 | 5,08 | 4,98 | 3,23 | 4,48 | 4,11 | 6,12 | 4,79 | 4,68 | 6,15 | 7,85 | 7,16 |
| 06.07.2025 | 5,01 | 4,67 | 5,69 | 5,89 | 3,91 | 6,37 | 9,06 | 10,3 | 11,8 | 12,1 | 10,4 | 7,83 |
| 05.07.2025 | 6,46 | 5,13 | 4,05 | 4,55 | 3,32 | 2,36 | 7,62 | 8,82 | 9,84 | 10,9 | 9,93 | 6,33 |
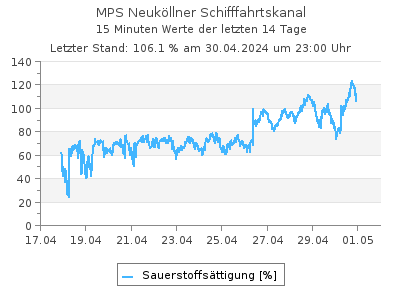
Aktuelle Werte Sauerstoffsättigung als Tabelle
Letzter Tagesmittelwert (11.07.2025): 7,35 %Werte Sauerstoffsättigung in % im Intervall von 2 Stunden (in MEZ), Quelle: Land Berlin
| 00:00 | 02:00 | 04:00 | 06:00 | 08:00 | 10:00 | 12:00 | 14:00 | 16:00 | 18:00 | 20:00 | 22:00 | |
|---|---|---|---|---|---|---|---|---|---|---|---|---|
| 12.07.2025 | 2,12 | - | - | - | - | - | - | - | - | - | - | - |
| 11.07.2025 | 0,780 | 0,890 | 0,890 | 0,780 | 0,890 | 0,890 | 15,4 | 26,2 | 14,4 | 15,7 | 1,79 | 3,68 |
| 10.07.2025 | 21,4 | 12,8 | 16,4 | 21,7 | 16,2 | 4,17 | 69,6 | 53,6 | 4,52 | 10,6 | 1,90 | 0,900 |
| 09.07.2025 | 26,6 | 24,9 | 11,5 | 18,1 | 23,5 | 39,2 | 26,4 | 57,0 | 67,4 | 69,9 | 28,8 | 43,0 |
| 08.07.2025 | 58,8 | 41,6 | 30,0 | 13,7 | 22,6 | 15,3 | 46,0 | 77,2 | 80,3 | 103 | 67,9 | 48,1 |
| 07.07.2025 | 80,6 | 59,1 | 57,7 | 37,3 | 51,7 | 47,5 | 70,7 | 55,5 | 54,7 | 72,0 | 91,4 | 83,0 |
| 06.07.2025 | 58,3 | 54,3 | 65,9 | 68,1 | 45,3 | 74,0 | 106 | 121 | 139 | 143 | 122 | 91,5 |
| 05.07.2025 | 75,5 | 59,7 | 47,0 | 52,6 | 38,3 | 27,3 | 88,5 | 104 | 116 | 128 | 116 | 73,9 |
| Messstellennummer | 504 |
|---|---|
| Messstellenname | MPS Neuköllner Schifffahrtskanal |
| Gewässer | Neuköllner Schifffahrtskanal |
| Betreiber | Land Berlin |
| Messstellenausprägung | Online-Messstelle |
| Flusskilometer | 0.73 |
| Rechtswert (UTM 33 N) | 394374.64 |
| Hochwert (UTM 33 N) | 5816093.86 |
Als Favorit speichern Als Favorit entfernen
Durch die Liste der Durchfluss-Messstellen blättern: