 DGS
DGS Leichte Sprache
MPS Neuköllner Schifffahrtskanal
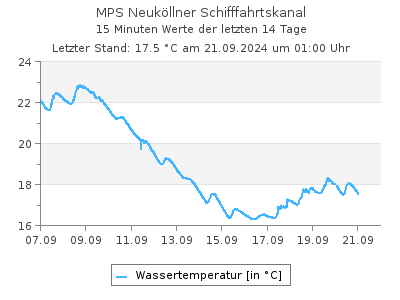
Aktuelle Wassertemperaturen als Tabelle
Letzter Tagesmittelwert (19.06.2025): 22,1 °CWassertemperaturen in °C im Intervall von 2 Stunden (in MEZ), Quelle: Land Berlin
| 00:00 | 02:00 | 04:00 | 06:00 | 08:00 | 10:00 | 12:00 | 14:00 | 16:00 | 18:00 | 20:00 | 22:00 | |
|---|---|---|---|---|---|---|---|---|---|---|---|---|
| 19.07.2025 | 21,0 | - | - | - | - | - | - | - | - | - | - | - |
| 18.07.2025 | 20,0 | 20,0 | 19,9 | 19,9 | 19,9 | 20,0 | 20,6 | 20,6 | 20,9 | 21,0 | 21,0 | 21,0 |
| 17.07.2025 | 20,6 | 20,4 | 20,3 | 20,2 | 20,3 | 20,3 | 20,3 | 20,2 | 20,1 | 20,1 | 20,1 | 20,1 |
| 16.07.2025 | 20,9 | 20,7 | 20,6 | 20,5 | 20,5 | 20,6 | 20,7 | 21,1 | 21,1 | 21,1 | 20,9 | 20,8 |
| 15.07.2025 | 21,4 | 21,2 | 21,1 | 21,0 | 20,9 | 20,9 | 21,1 | 21,0 | 21,2 | 21,1 | 21,1 | 21,0 |
| 14.07.2025 | 20,3 | 20,1 | 20,1 | 20,1 | 20,1 | 20,3 | 20,8 | 21,4 | 21,7 | 21,7 | 21,7 | 21,5 |
| 13.07.2025 | 19,9 | 18,7 | 18,9 | 18,9 | 18,9 | 19,1 | 19,5 | 19,7 | 19,8 | 20,0 | 20,1 | 20,2 |
| 12.07.2025 | 20,6 | 20,5 | 20,4 | 20,3 | 20,2 | 20,2 | 20,2 | 19,9 | 19,9 | 20,0 | 19,9 | 19,9 |
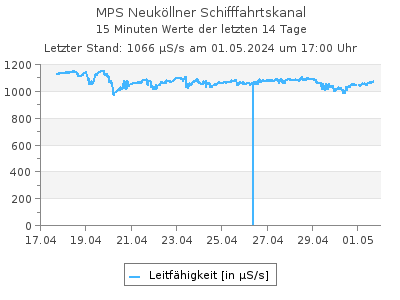
Aktuelle Leitfähigkeit als Tabelle
Letzter Tagesmittelwert (19.06.2025): 1.012 µS/sLeitfähigkeit in µS/s im Intervall von 2 Stunden (in MEZ), Quelle: Land Berlin
| 00:00 | 02:00 | 04:00 | 06:00 | 08:00 | 10:00 | 12:00 | 14:00 | 16:00 | 18:00 | 20:00 | 22:00 | |
|---|---|---|---|---|---|---|---|---|---|---|---|---|
| 19.07.2025 | 864 | - | - | - | - | - | - | - | - | - | - | - |
| 18.07.2025 | 880 | 882 | 877 | 874 | 871 | 869 | 854 | 841 | 836 | 841 | 853 | 860 |
| 17.07.2025 | 955 | 947 | 943 | 945 | 943 | 938 | 934 | 938 | 925 | 891 | 879 | 879 |
| 16.07.2025 | 984 | 984 | 984 | 980 | 977 | 974 | 977 | 975 | 966 | 951 | 953 | 956 |
| 15.07.2025 | 978 | 974 | 972 | 974 | 991 | 991 | 989 | 989 | 991 | 989 | 983 | 981 |
| 14.07.2025 | 969 | 913 | 960 | 989 | 997 | 1.002 | 1.031 | 1.036 | 1.028 | 1.002 | 985 | 983 |
| 13.07.2025 | 1.187 | 694 | 805 | 805 | 830 | 854 | 941 | 904 | 905 | 924 | 943 | 969 |
| 12.07.2025 | 1.202 | 1.203 | 1.207 | 1.207 | 1.206 | 1.221 | 1.225 | 1.076 | 1.077 | 1.091 | 1.118 | 1.144 |
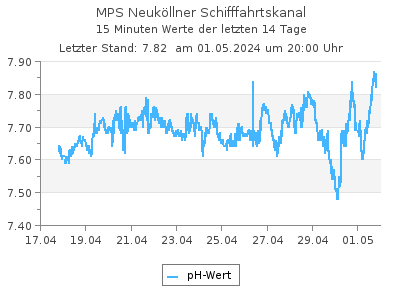
Aktuelle pH-Werte als Tabelle
Letzter Tagesmittelwert (19.06.2025): 8,23pH-Werte im Intervall von 2 Stunden (in MEZ), Quelle: Land Berlin
| 00:00 | 02:00 | 04:00 | 06:00 | 08:00 | 10:00 | 12:00 | 14:00 | 16:00 | 18:00 | 20:00 | 22:00 | |
|---|---|---|---|---|---|---|---|---|---|---|---|---|
| 19.07.2025 | 7,53 | - | - | - | - | - | - | - | - | - | - | - |
| 18.07.2025 | 7,55 | 7,55 | 7,56 | 7,56 | 7,56 | 7,56 | 7,56 | 7,57 | 7,56 | 7,53 | 7,53 | 7,54 |
| 17.07.2025 | 7,55 | 7,55 | 7,55 | 7,55 | 7,55 | 7,55 | 7,53 | 7,53 | 7,52 | 7,52 | 7,53 | 7,54 |
| 16.07.2025 | 7,57 | 7,58 | 7,57 | 7,58 | 7,59 | 7,59 | 7,56 | 7,57 | 7,55 | 7,57 | 7,59 | 7,57 |
| 15.07.2025 | 7,75 | 7,76 | 7,72 | 7,66 | 7,65 | 7,70 | 7,67 | 7,60 | 7,59 | 7,60 | 7,59 | 7,57 |
| 14.07.2025 | 7,71 | 7,76 | 7,75 | 7,72 | 7,75 | 7,75 | 7,69 | 7,70 | 7,69 | 7,70 | 7,65 | 7,71 |
| 13.07.2025 | 7,76 | 7,53 | 7,56 | 7,59 | 7,61 | 7,64 | 7,60 | 7,59 | 7,62 | 7,63 | 7,66 | 7,68 |
| 12.07.2025 | 7,79 | 7,76 | 7,75 | 7,76 | 7,76 | 7,80 | 7,85 | 7,80 | 7,81 | 7,77 | 7,76 | 7,75 |
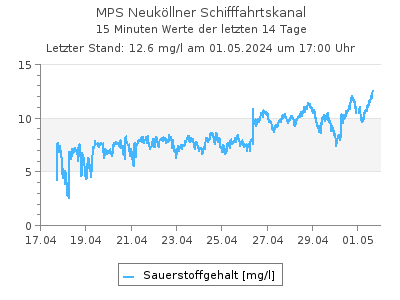
Aktuelle Sauerstoffgehalt-Werte als Tabelle
Letzter Tagesmittelwert (19.06.2025): 10,4 mg/lSauerstoffgehalt-Werte in mg/l im Intervall von 2 Stunden (in MEZ), Quelle: Land Berlin
| 00:00 | 02:00 | 04:00 | 06:00 | 08:00 | 10:00 | 12:00 | 14:00 | 16:00 | 18:00 | 20:00 | 22:00 | |
|---|---|---|---|---|---|---|---|---|---|---|---|---|
| 19.07.2025 | 0,270 | - | - | - | - | - | - | - | - | - | - | - |
| 18.07.2025 | 0,060 | 0,060 | 0,060 | 0,060 | 0,070 | 0,060 | 2,16 | 2,15 | 2,88 | 1,79 | 2,01 | 1,24 |
| 17.07.2025 | 0,220 | 0,090 | 0,070 | 0,060 | 0,070 | 0,060 | 1,35 | 1,07 | 0,150 | 0,060 | 0,060 | 0,060 |
| 16.07.2025 | 0,070 | 0,070 | 0,070 | 0,060 | 0,060 | 0,060 | 0,750 | 1,74 | 0,300 | 1,29 | 2,09 | 0,910 |
| 15.07.2025 | 0,060 | 0,060 | 0,060 | 0,060 | 0,060 | 0,060 | 0,250 | 0,750 | 0,070 | 0,750 | 0,210 | 0,090 |
| 14.07.2025 | 0,060 | 0,060 | 0,060 | 0,060 | 0,060 | 0,060 | 0,060 | 0,060 | 0,060 | 0,060 | 0,060 | 0,060 |
| 13.07.2025 | 0,200 | 0,060 | 0,070 | 0,060 | 0,060 | 0,070 | 0,060 | 0,060 | 0,060 | 0,060 | 0,060 | 0,060 |
| 12.07.2025 | 0,190 | 0,060 | 0,080 | 0,080 | 0,100 | 0,300 | 1,50 | 0,630 | 0,180 | 0,070 | 0,070 | 0,060 |
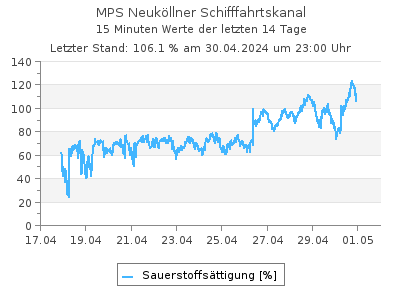
Aktuelle Werte Sauerstoffsättigung als Tabelle
Letzter Tagesmittelwert (17.07.2025): 2,92 %Werte Sauerstoffsättigung in % im Intervall von 2 Stunden (in MEZ), Quelle: Land Berlin
| 00:00 | 02:00 | 04:00 | 06:00 | 08:00 | 10:00 | 12:00 | 14:00 | 16:00 | 18:00 | 20:00 | 22:00 | |
|---|---|---|---|---|---|---|---|---|---|---|---|---|
| 19.07.2025 | - | - | - | - | - | - | - | - | - | - | - | - |
| 18.07.2025 | 0,660 | - | - | - | - | - | - | - | - | - | - | - |
| 17.07.2025 | 2,45 | 1,00 | 0,780 | 0,660 | 0,770 | 0,670 | 15,0 | 11,8 | 1,66 | 0,660 | 0,660 | 0,660 |
| 16.07.2025 | 0,780 | 0,780 | 0,780 | 0,670 | 0,670 | 0,670 | 8,38 | 19,6 | 3,38 | 14,5 | 23,5 | 10,2 |
| 15.07.2025 | 0,680 | 0,680 | 0,680 | 0,670 | 0,670 | 0,670 | 2,81 | 8,43 | 0,790 | 8,45 | 2,36 | 1,01 |
| 14.07.2025 | 0,660 | 0,660 | 0,660 | 0,660 | 0,660 | 0,670 | 0,670 | 0,680 | 0,680 | 0,680 | 0,680 | 0,680 |
| 13.07.2025 | 2,20 | 0,640 | 0,750 | 0,650 | 0,650 | 0,760 | 0,650 | 0,660 | 0,660 | 0,660 | 0,660 | 0,660 |
| 12.07.2025 | 2,12 | 0,670 | 0,890 | 0,890 | 1,11 | 3,32 | 16,6 | 6,93 | 1,98 | 0,770 | 0,770 | 0,660 |
| Messstellennummer | 504 |
|---|---|
| Messstellenname | MPS Neuköllner Schifffahrtskanal |
| Gewässer | Neuköllner Schifffahrtskanal |
| Betreiber | Land Berlin |
| Messstellenausprägung | Online-Messstelle |
| Flusskilometer | 0.73 |
| Rechtswert (UTM 33 N) | 394374.64 |
| Hochwert (UTM 33 N) | 5816093.86 |
Als Favorit speichern Als Favorit entfernen
Durch die Liste der Wasserstand-Messstellen blättern: