 DGS
DGS Leichte Sprache
MPS Teltowkanal
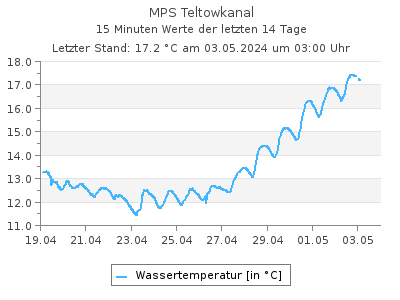
Aktuelle Wassertemperaturen als Tabelle
Letzter Tagesmittelwert (19.06.2025): 21,9 °CWassertemperaturen in °C im Intervall von 2 Stunden (in MEZ), Quelle: Land Berlin
| 00:00 | 02:00 | 04:00 | 06:00 | 08:00 | 10:00 | 12:00 | 14:00 | 16:00 | 18:00 | 20:00 | 22:00 | |
|---|---|---|---|---|---|---|---|---|---|---|---|---|
| 01.07.2025 | - | - | - | - | - | - | - | - | - | - | - | - |
| 30.06.2025 | - | 22,6 | 22,4 | 22,2 | 22,1 | 22,3 | 16,3 | 23,2 | 22,9 | 23,1 | 23,2 | 23,0 |
| 29.06.2025 | 22,7 | 22,5 | 22,4 | 22,2 | 22,3 | 22,5 | 22,8 | 23,1 | 23,7 | 23,3 | 23,0 | 23,1 |
| 28.06.2025 | 21,3 | 21,2 | 21,1 | 21,0 | 21,1 | 21,5 | 22,0 | 22,4 | 22,4 | 22,6 | 22,5 | 22,6 |
| 27.06.2025 | 21,7 | 21,6 | 21,5 | 21,5 | 21,5 | 21,6 | 21,5 | 21,9 | 21,6 | 21,9 | 21,5 | 21,4 |
| 26.06.2025 | 21,7 | 21,5 | 21,3 | 21,2 | 21,3 | 21,3 | 21,3 | 22,0 | 21,8 | 21,9 | 21,8 | 21,7 |
| 25.06.2025 | 21,4 | 21,3 | 21,2 | 21,2 | 21,2 | 21,0 | 21,2 | 21,8 | 21,8 | 21,8 | 22,0 | 21,8 |
| 24.06.2025 | 22,2 | 22,0 | 21,9 | 21,7 | 21,6 | 21,6 | 21,6 | 21,6 | 21,8 | 21,7 | 21,5 | 21,5 |
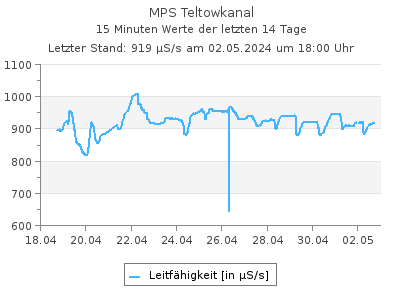
Aktuelle Leitfähigkeit als Tabelle
Letzter Tagesmittelwert (19.06.2025): 1.235 µS/sLeitfähigkeit in µS/s im Intervall von 2 Stunden (in MEZ), Quelle: Land Berlin
| 00:00 | 02:00 | 04:00 | 06:00 | 08:00 | 10:00 | 12:00 | 14:00 | 16:00 | 18:00 | 20:00 | 22:00 | |
|---|---|---|---|---|---|---|---|---|---|---|---|---|
| 01.07.2025 | - | - | - | - | - | - | - | - | - | - | - | - |
| 30.06.2025 | - | 1.114 | 1.114 | 1.106 | 1.105 | 1.105 | 4,00 | 1.107 | 1.103 | 1.101 | 1.104 | 1.108 |
| 29.06.2025 | 1.111 | 1.111 | 1.112 | 1.112 | 1.105 | 1.102 | 1.104 | 1.105 | 1.112 | 1.111 | 1.106 | 1.109 |
| 28.06.2025 | 1.103 | 1.107 | 1.108 | 1.111 | 1.123 | 1.115 | 1.112 | 1.110 | 1.117 | 1.115 | 1.111 | 1.112 |
| 27.06.2025 | 1.078 | 1.082 | 1.081 | 1.083 | 1.123 | 1.107 | 1.105 | 1.098 | 1.114 | 1.095 | 1.099 | 1.100 |
| 26.06.2025 | 1.160 | 1.160 | 1.149 | 1.142 | 1.136 | 1.109 | 1.046 | 1.035 | 1.112 | 1.142 | 1.076 | 1.065 |
| 25.06.2025 | 1.172 | 1.175 | 1.173 | 1.169 | 1.165 | 1.116 | 1.120 | 1.100 | 1.134 | 1.127 | 1.162 | 1.156 |
| 24.06.2025 | 1.175 | 1.176 | 1.175 | 1.173 | 1.171 | 1.173 | 1.176 | 1.173 | 1.172 | 1.175 | 1.173 | 1.171 |
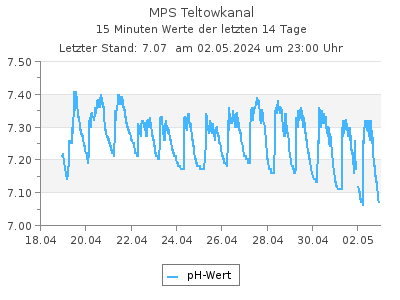
Aktuelle pH-Werte als Tabelle
Letzter Tagesmittelwert (09.04.2025): 7,71pH-Werte im Intervall von 2 Stunden (in MEZ), Quelle: Land Berlin
| 00:00 | 02:00 | 04:00 | 06:00 | 08:00 | 10:00 | 12:00 | 14:00 | 16:00 | 18:00 | 20:00 | 22:00 | |
|---|---|---|---|---|---|---|---|---|---|---|---|---|
| 01.07.2025 | - | - | - | - | - | - | - | - | - | - | - | - |
| 30.06.2025 | - | 7,07 | 7,08 | 7,09 | 7,15 | 7,15 | 7,80 | 7,29 | 7,28 | 7,14 | 7,20 | 7,39 |
| 29.06.2025 | 7,13 | 7,14 | 7,16 | 7,16 | 7,11 | 7,12 | 7,12 | 7,17 | 7,18 | 7,10 | 7,16 | 7,06 |
| 28.06.2025 | 7,20 | 7,25 | 7,29 | 7,31 | 7,19 | 7,16 | 7,15 | 7,16 | 7,14 | 7,14 | 7,12 | 7,12 |
| 27.06.2025 | 7,20 | 7,24 | 7,25 | 7,30 | 7,18 | 7,16 | 7,14 | 7,13 | 7,14 | 7,11 | 7,15 | 7,17 |
| 26.06.2025 | 7,12 | 7,14 | 7,15 | 7,16 | 7,17 | 7,13 | 7,09 | 7,12 | 7,14 | 7,16 | 7,17 | 7,18 |
| 25.06.2025 | 7,21 | 7,26 | 7,23 | 7,21 | 7,27 | 7,23 | 7,22 | 7,14 | 7,22 | 7,18 | 7,11 | 7,11 |
| 24.06.2025 | 7,17 | 7,17 | 7,18 | 7,18 | 7,30 | 7,32 | 7,34 | 7,29 | 7,31 | 7,34 | 7,22 | 7,19 |
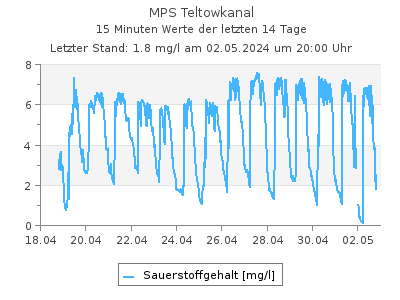
Aktuelle Sauerstoffgehalt-Werte als Tabelle
Letzter Tagesmittelwert (19.06.2025): 1,77 mg/lSauerstoffgehalt-Werte in mg/l im Intervall von 2 Stunden (in MEZ), Quelle: Land Berlin
| 00:00 | 02:00 | 04:00 | 06:00 | 08:00 | 10:00 | 12:00 | 14:00 | 16:00 | 18:00 | 20:00 | 22:00 | |
|---|---|---|---|---|---|---|---|---|---|---|---|---|
| 01.07.2025 | - | - | - | - | - | - | - | - | - | - | - | - |
| 30.06.2025 | - | 0,100 | 0,110 | 1,37 | 4,25 | 3,76 | 9,89 | 6,04 | 5,05 | 0,390 | 0,950 | 6,97 |
| 29.06.2025 | 0,100 | 0,110 | 0,100 | 0,110 | 0,410 | 3,28 | 3,52 | 5,17 | 6,25 | 3,01 | 4,57 | 0,110 |
| 28.06.2025 | 0,110 | 0,110 | 0,110 | 0,110 | 0,100 | 0,990 | 1,85 | 2,60 | 2,39 | 1,92 | 0,910 | 0,100 |
| 27.06.2025 | 0,110 | 0,110 | 0,110 | 0,110 | 0,110 | 0,120 | 0,390 | 0,150 | 0,160 | 1,06 | 0,110 | 0,100 |
| 26.06.2025 | 0,110 | 0,110 | 0,100 | 0,110 | 0,110 | 0,190 | 0,130 | 0,110 | 0,120 | 0,160 | 0,100 | 0,100 |
| 25.06.2025 | 2,07 | 2,86 | 0,940 | 0,710 | 3,26 | 3,39 | 3,05 | 2,55 | 4,23 | 3,35 | 1,26 | 1,06 |
| 24.06.2025 | 1,85 | 1,60 | 1,49 | 1,87 | 4,53 | 4,76 | 5,21 | 4,23 | 4,60 | 5,19 | 2,38 | 1,35 |
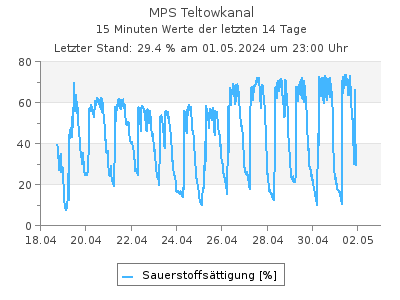
Aktuelle Werte Sauerstoffsättigung als Tabelle
Letzter Tagesmittelwert (28.06.2025): 10,5 %Werte Sauerstoffsättigung in % im Intervall von 2 Stunden (in MEZ), Quelle: Land Berlin
| 00:00 | 02:00 | 04:00 | 06:00 | 08:00 | 10:00 | 12:00 | 14:00 | 16:00 | 18:00 | 20:00 | 22:00 | |
|---|---|---|---|---|---|---|---|---|---|---|---|---|
| 01.07.2025 | - | - | - | - | - | - | - | - | - | - | - | - |
| 30.06.2025 | - | - | - | - | - | - | - | - | - | - | - | - |
| 29.06.2025 | 1,16 | 1,27 | 1,15 | 1,27 | 4,72 | 37,9 | 40,9 | 60,4 | 74,0 | 35,4 | 53,3 | 1,29 |
| 28.06.2025 | 1,24 | 1,24 | 1,24 | 1,24 | 1,12 | 11,2 | 21,2 | 30,0 | 27,6 | 22,2 | 10,5 | 1,16 |
| 27.06.2025 | 1,25 | 1,25 | 1,25 | 1,25 | 1,25 | 1,36 | 4,42 | 1,72 | 1,82 | 12,1 | 1,25 | 1,13 |
| 26.06.2025 | 1,25 | 1,25 | 1,13 | 1,24 | 1,24 | 2,15 | 1,47 | 1,26 | 1,37 | 1,83 | 1,14 | 1,14 |
| 25.06.2025 | 23,5 | 32,3 | 10,6 | 8,01 | 36,8 | 38,1 | 34,4 | 29,1 | 48,3 | 38,2 | 14,4 | 12,1 |
| 24.06.2025 | 21,3 | 18,3 | 17,0 | 21,3 | 51,5 | 54,1 | 59,2 | 48,1 | 52,5 | 59,1 | 27,0 | 15,3 |
| Messstellennummer | 414 |
|---|---|
| Messstellenname | MPS Teltowkanal |
| Gewässer | Teltowkanal |
| Betreiber | Land Berlin |
| Messstellenausprägung | Online-Messstelle |
| Flusskilometer | 19.05 |
| Rechtswert (UTM 33 N) | 386481.64 |
| Hochwert (UTM 33 N) | 5811802.25 |
Als Favorit speichern Als Favorit entfernen
Durch die Liste der Wasserstand-Messstellen blättern: