 DGS
DGS Leichte Sprache


MPS Neuköllner Schifffahrtskanal
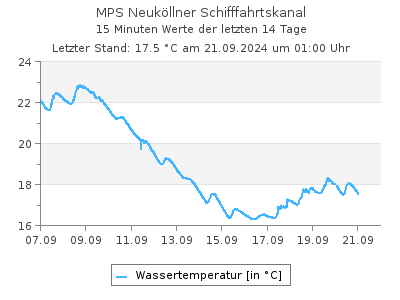
Aktuelle Wassertemperaturen als Tabelle
Letzter Tagesmittelwert (28.06.2026): 27,7 °CWassertemperaturen in °C im Intervall von 2 Stunden (in MEZ), Quelle: Land Berlin
| 00:00 | 02:00 | 04:00 | 06:00 | 08:00 | 10:00 | 12:00 | 14:00 | 16:00 | 18:00 | 20:00 | 22:00 | |
|---|---|---|---|---|---|---|---|---|---|---|---|---|
| 03.07.2026 | 24,7 | 24,5 | 24,2 | 23,9 | 23,7 | - | - | - | - | - | - | - |
| 02.07.2026 | 25,3 | 25,1 | 24,9 | 24,7 | 24,6 | 25,0 | 25,3 | 25,4 | 25,7 | 25,4 | 25,1 | 24,9 |
| 01.07.2026 | 26,4 | 26,3 | 26,1 | 25,9 | 25,8 | 25,7 | 25,8 | 26,0 | 25,9 | 25,8 | 25,7 | 25,5 |
| 30.06.2026 | 26,4 | 26,2 | 26,0 | 25,8 | 25,7 | 25,9 | 26,6 | 27,2 | 27,2 | 27,1 | 26,8 | 26,6 |
| 29.06.2026 | 27,7 | 27,5 | 27,3 | 27,1 | 26,9 | 27,0 | 26,9 | 26,8 | 27,1 | 27,0 | 26,8 | 26,6 |
| 28.06.2026 | 27,6 | 27,4 | 27,2 | 27,0 | 27,0 | 27,3 | 27,7 | 27,9 | 28,8 | 28,7 | 28,2 | 28,0 |
| 27.06.2026 | 26,7 | 26,5 | 26,3 | 26,0 | 25,9 | 26,2 | 27,1 | 27,2 | 27,7 | 28,0 | 27,9 | 27,9 |
| 26.06.2026 | 25,9 | 25,6 | 25,4 | 25,2 | 25,1 | 25,5 | 26,2 | 26,6 | 27,1 | 27,2 | 27,4 | 27,1 |
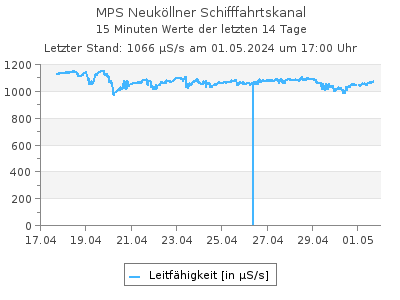
Aktuelle Leitfähigkeit als Tabelle
Letzter Tagesmittelwert (26.05.2026): 941 µS/sLeitfähigkeit in µS/s im Intervall von 2 Stunden (in MEZ), Quelle: Land Berlin
| 00:00 | 02:00 | 04:00 | 06:00 | 08:00 | 10:00 | 12:00 | 14:00 | 16:00 | 18:00 | 20:00 | 22:00 | |
|---|---|---|---|---|---|---|---|---|---|---|---|---|
| 03.07.2026 | 1.029 | 1.033 | 1.038 | 1.040 | 1.040 | - | - | - | - | - | - | - |
| 02.07.2026 | 1.024 | 1.027 | 1.027 | 1.030 | 1.032 | 1.029 | 1.029 | 1.020 | 1.000 | 1.005 | 1.018 | 1.021 |
| 01.07.2026 | 1.017 | 1.017 | 1.014 | 1.015 | 1.017 | 1.015 | 1.016 | 1.022 | 1.009 | 1.015 | 1.020 | 1.021 |
| 30.06.2026 | 981 | 988 | 991 | 993 | 991 | 992 | 993 | 968 | 974 | 987 | 1.011 | 1.016 |
| 29.06.2026 | 942 | 939 | 937 | 901 | 939 | 949 | 957 | 962 | 946 | 943 | 957 | 971 |
| 28.06.2026 | 997 | 985 | 978 | 967 | 960 | 966 | 952 | 951 | 925 | 913 | 949 | 935 |
| 27.06.2026 | 997 | 997 | 994 | 989 | 993 | 992 | 1.001 | 1.012 | 1.008 | 1.011 | 1.009 | 1.003 |
| 26.06.2026 | 965 | 968 | 972 | 979 | 994 | 993 | 983 | 990 | 995 | 998 | 998 | 1.003 |
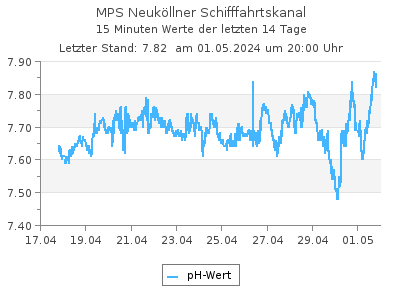
Aktuelle pH-Werte als Tabelle
Letzter Tagesmittelwert (26.05.2026): 7,60pH-Werte im Intervall von 2 Stunden (in MEZ), Quelle: Land Berlin
| 00:00 | 02:00 | 04:00 | 06:00 | 08:00 | 10:00 | 12:00 | 14:00 | 16:00 | 18:00 | 20:00 | 22:00 | |
|---|---|---|---|---|---|---|---|---|---|---|---|---|
| 03.07.2026 | 7,50 | 7,51 | 7,51 | 7,51 | 7,52 | - | - | - | - | - | - | - |
| 02.07.2026 | 7,49 | 7,50 | 7,49 | 7,50 | 7,50 | 7,51 | 7,54 | 7,54 | 7,54 | 7,54 | 7,53 | 7,50 |
| 01.07.2026 | 7,54 | 7,52 | 7,51 | 7,49 | 7,52 | 7,51 | 7,54 | 7,56 | 7,58 | 7,56 | 7,53 | 7,50 |
| 30.06.2026 | 7,59 | 7,52 | 7,51 | 7,49 | 7,50 | 7,53 | 7,52 | 7,62 | 7,57 | 7,66 | 7,70 | 7,61 |
| 29.06.2026 | 7,66 | 7,61 | 7,62 | 7,61 | 7,62 | 7,62 | 7,71 | 7,66 | 7,79 | 7,73 | 7,60 | 7,61 |
| 28.06.2026 | 8,02 | 7,92 | 7,87 | 7,92 | 7,77 | 7,83 | 7,75 | 7,77 | 7,78 | 7,80 | 7,75 | 7,71 |
| 27.06.2026 | 8,41 | 8,31 | 8,34 | 8,24 | 8,19 | 8,14 | 8,29 | 8,16 | 8,27 | 8,30 | 8,28 | 8,17 |
| 26.06.2026 | 8,18 | 8,12 | 7,96 | 7,94 | 7,92 | 8,39 | 8,13 | 8,12 | 8,12 | 8,21 | 8,61 | 8,44 |
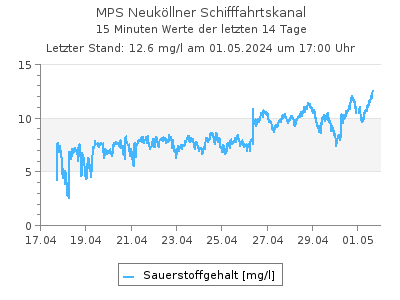
Aktuelle Sauerstoffgehalt-Werte als Tabelle
Letzter Tagesmittelwert (26.05.2026): 8,78 mg/lSauerstoffgehalt-Werte in mg/l im Intervall von 2 Stunden (in MEZ), Quelle: Land Berlin
| 00:00 | 02:00 | 04:00 | 06:00 | 08:00 | 10:00 | 12:00 | 14:00 | 16:00 | 18:00 | 20:00 | 22:00 | |
|---|---|---|---|---|---|---|---|---|---|---|---|---|
| 03.07.2026 | 1,12 | 1,38 | 1,32 | 1,33 | 1,54 | - | - | - | - | - | - | - |
| 02.07.2026 | 2,14 | 0,760 | 1,04 | 0,890 | 0,960 | 1,66 | 2,57 | 2,56 | 2,60 | 2,83 | 2,86 | 1,22 |
| 01.07.2026 | 3,12 | 2,42 | 2,30 | 2,36 | 3,19 | 2,62 | 3,51 | 2,55 | 3,41 | 3,75 | 3,18 | 2,53 |
| 30.06.2026 | 3,72 | 2,58 | 2,54 | 1,62 | 2,05 | 2,69 | 1,81 | 4,67 | 4,16 | 5,83 | 6,33 | 3,46 |
| 29.06.2026 | 6,03 | 4,88 | 5,14 | 4,74 | 4,79 | 4,26 | 5,73 | 5,71 | 6,91 | 4,50 | 4,00 | 3,65 |
| 28.06.2026 | 9,18 | 8,28 | 8,04 | 8,20 | 7,33 | 7,73 | 7,40 | 7,77 | 7,05 | 7,20 | 7,05 | 6,61 |
| 27.06.2026 | 12,1 | 11,5 | 11,5 | 11,0 | 10,4 | 10,1 | 11,1 | 10,5 | 11,0 | 10,9 | 11,0 | 10,4 |
| 26.06.2026 | 10,7 | 10,4 | 8,95 | 8,71 | 8,65 | 9,71 | 11,0 | 10,5 | 10,1 | 11,0 | 13,8 | 12,6 |
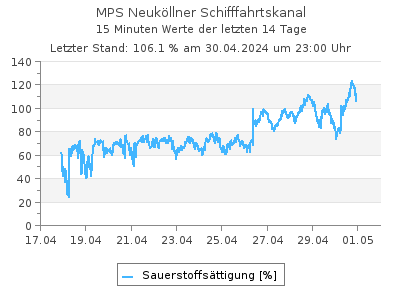
Aktuelle Werte Sauerstoffsättigung als Tabelle
Letzter Tagesmittelwert (02.07.2026): 23,5 %Werte Sauerstoffsättigung in % im Intervall von 2 Stunden (in MEZ), Quelle: Land Berlin
| 00:00 | 02:00 | 04:00 | 06:00 | 08:00 | 10:00 | 12:00 | 14:00 | 16:00 | 18:00 | 20:00 | 22:00 | |
|---|---|---|---|---|---|---|---|---|---|---|---|---|
| 03.07.2026 | 13,5 | - | - | - | - | - | - | - | - | - | - | - |
| 02.07.2026 | 26,1 | 9,22 | 12,6 | 10,7 | 11,5 | 20,1 | 31,3 | 31,3 | 31,9 | 34,6 | 34,7 | 14,8 |
| 01.07.2026 | 38,8 | 30,0 | 28,4 | 29,1 | 39,2 | 32,2 | 43,1 | 31,5 | 42,0 | 46,1 | 39,0 | 30,9 |
| 30.06.2026 | 46,2 | 32,0 | 31,3 | 19,9 | 25,2 | 33,1 | 22,6 | 58,9 | 52,4 | 73,3 | 79,3 | 43,2 |
| 29.06.2026 | 76,7 | 61,8 | 64,9 | 59,6 | 60,1 | 53,5 | 71,8 | 71,5 | 87,0 | 56,6 | 50,1 | 45,5 |
| 28.06.2026 | 117 | 105 | 101 | 103 | 92,0 | 97,6 | 94,1 | 99,3 | 91,5 | 93,3 | 90,4 | 84,5 |
| 27.06.2026 | 151 | 143 | 143 | 136 | 127 | 124 | 140 | 133 | 140 | 139 | 140 | 132 |
| 26.06.2026 | 132 | 127 | 109 | 106 | 105 | 119 | 136 | 131 | 126 | 139 | 174 | 158 |
| Messstellennummer | 504 |
|---|---|
| Messstellenname | MPS Neuköllner Schifffahrtskanal |
| Gewässer | Neuköllner Schifffahrtskanal |
| Betreiber | Land Berlin |
| Messstellenausprägung | Online-Messstelle |
| Flusskilometer | 0.73 |
| Rechtswert (UTM 33 N) | 394374.64 |
| Hochwert (UTM 33 N) | 5816093.86 |
Als Favorit speichern Als Favorit entfernen
Durch die Liste der Wasserqualität-Messstellen blättern: