 DGS
DGS Leichte Sprache
MPS Berlin-Spandauer-Schifffahrtskanal
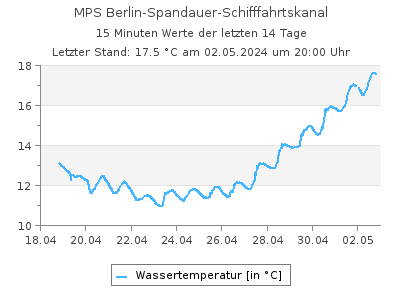
Aktuelle Wassertemperaturen als Tabelle
Letzter Tagesmittelwert (26.05.2026): 21,3 °CWassertemperaturen in °C im Intervall von 2 Stunden (in MEZ), Quelle: Land Berlin
| 00:00 | 02:00 | 04:00 | 06:00 | 08:00 | 10:00 | 12:00 | 14:00 | 16:00 | 18:00 | 20:00 | 22:00 | |
|---|---|---|---|---|---|---|---|---|---|---|---|---|
| 24.06.2026 | 23,3 | 23,3 | 23,1 | 23,0 | 23,2 | 23,6 | 23,8 | 24,3 | - | - | - | - |
| 23.06.2026 | 22,8 | 22,7 | 22,5 | 22,4 | 22,4 | 22,8 | 23,3 | 23,4 | 23,9 | 23,7 | 23,5 | 23,4 |
| 22.06.2026 | 22,2 | 22,2 | 22,1 | 22,0 | 22,2 | 22,4 | 23,2 | 23,5 | 24,4 | 24,2 | 23,2 | 23,0 |
| 21.06.2026 | 22,4 | 22,4 | 22,3 | 22,3 | 22,4 | 22,7 | 22,3 | 22,3 | 22,4 | 22,5 | 22,5 | 22,3 |
| 20.06.2026 | 21,8 | 21,7 | 21,7 | 21,7 | 21,8 | 22,2 | 22,7 | 22,6 | 22,5 | 22,5 | 22,5 | 22,5 |
| 19.06.2026 | 20,3 | 20,3 | 20,3 | 20,3 | 20,5 | 20,9 | 21,2 | 21,5 | 22,0 | 22,3 | 22,0 | 21,9 |
| 18.06.2026 | 19,2 | 19,3 | 19,4 | 19,5 | 19,3 | 19,7 | 19,9 | 20,2 | 20,2 | 20,3 | 20,4 | 20,3 |
| 17.06.2026 | 18,0 | 18,0 | 17,8 | 17,7 | 18,0 | 18,2 | 18,6 | 19,0 | 19,4 | 19,3 | 19,4 | 19,2 |
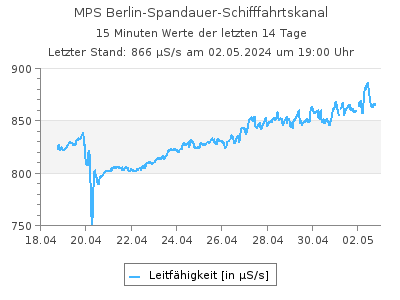
Aktuelle Leitfähigkeit als Tabelle
Letzter Tagesmittelwert (26.05.2026): 956 µS/sLeitfähigkeit in µS/s im Intervall von 2 Stunden (in MEZ), Quelle: Land Berlin
| 00:00 | 02:00 | 04:00 | 06:00 | 08:00 | 10:00 | 12:00 | 14:00 | 16:00 | 18:00 | 20:00 | 22:00 | |
|---|---|---|---|---|---|---|---|---|---|---|---|---|
| 24.06.2026 | 820 | 849 | 867 | 884 | 891 | 898 | 900 | 915 | - | - | - | - |
| 23.06.2026 | 670 | 687 | 708 | 726 | 748 | 773 | 767 | 697 | 766 | 777 | 810 | 815 |
| 22.06.2026 | 657 | 642 | 637 | 651 | 638 | 642 | 650 | 646 | 648 | 652 | 647 | 654 |
| 21.06.2026 | 952 | 952 | 951 | 950 | 944 | 946 | 891 | 889 | 803 | 805 | 778 | 669 |
| 20.06.2026 | 925 | 925 | 924 | 924 | 926 | 934 | 942 | 940 | 942 | 947 | 952 | 954 |
| 19.06.2026 | 930 | 931 | 932 | 933 | 934 | 931 | 930 | 929 | 932 | 931 | 928 | 928 |
| 18.06.2026 | 949 | 937 | 928 | 909 | 935 | 927 | 469 | 925 | 928 | 927 | 927 | 928 |
| 17.06.2026 | 982 | 985 | 984 | 930 | 976 | 961 | 957 | 955 | 954 | 951 | 947 | 951 |
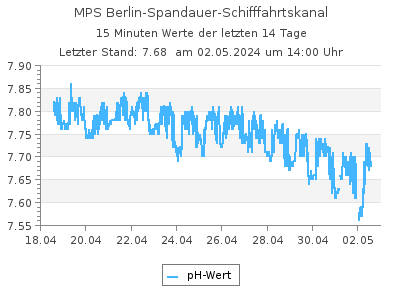
Aktuelle pH-Werte als Tabelle
Letzter Tagesmittelwert (26.05.2026): 7,17pH-Werte im Intervall von 2 Stunden (in MEZ), Quelle: Land Berlin
| 00:00 | 02:00 | 04:00 | 06:00 | 08:00 | 10:00 | 12:00 | 14:00 | 16:00 | 18:00 | 20:00 | 22:00 | |
|---|---|---|---|---|---|---|---|---|---|---|---|---|
| 24.06.2026 | 7,68 | 7,77 | 7,83 | 7,74 | 7,73 | 7,73 | 7,71 | 7,72 | - | - | - | - |
| 23.06.2026 | 7,26 | 7,41 | 7,59 | 7,39 | 7,43 | 7,52 | 7,49 | 7,53 | 7,46 | 7,48 | 7,56 | 7,61 |
| 22.06.2026 | 6,95 | 6,86 | 6,76 | 6,75 | 6,67 | 6,65 | 6,65 | 6,65 | 6,65 | 7,08 | 7,05 | 7,09 |
| 21.06.2026 | 7,53 | 7,49 | 7,46 | 7,47 | 7,53 | 7,55 | 7,57 | 7,57 | 7,49 | 7,45 | 7,34 | 7,09 |
| 20.06.2026 | 7,53 | 7,50 | 7,51 | 7,54 | 7,55 | 7,58 | 7,60 | 7,59 | 7,58 | 7,59 | 7,58 | 7,57 |
| 19.06.2026 | 7,63 | 7,59 | 7,59 | 7,62 | 7,63 | 7,64 | 7,64 | 7,63 | 7,62 | 7,64 | 7,61 | 7,56 |
| 18.06.2026 | 7,68 | 7,69 | 7,69 | 7,69 | 7,69 | 7,73 | 7,70 | 7,75 | 7,72 | 7,70 | 7,67 | 7,63 |
| 17.06.2026 | 7,72 | 7,72 | 7,72 | 7,73 | 7,74 | 7,76 | 7,74 | 7,76 | 7,73 | 7,73 | 7,76 | 7,72 |
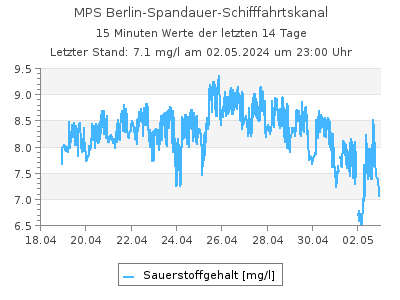
Aktuelle Sauerstoffgehalt-Werte als Tabelle
Letzter Tagesmittelwert (26.05.2026): 5,22 mg/lSauerstoffgehalt-Werte in mg/l im Intervall von 2 Stunden (in MEZ), Quelle: Land Berlin
| 00:00 | 02:00 | 04:00 | 06:00 | 08:00 | 10:00 | 12:00 | 14:00 | 16:00 | 18:00 | 20:00 | 22:00 | |
|---|---|---|---|---|---|---|---|---|---|---|---|---|
| 24.06.2026 | 0,040 | 0,040 | 0,040 | 0,030 | 0,040 | 0,090 | 0,170 | 0,190 | - | - | - | - |
| 23.06.2026 | 0,030 | 0,030 | 0,040 | 0,070 | 0,030 | 0,040 | 0,030 | 0,090 | 0,040 | 0,030 | 0,030 | 0,040 |
| 22.06.2026 | 0,030 | 0,040 | 0,030 | 0,030 | 0,050 | 0,030 | 0,040 | 0,030 | 0,030 | 0,100 | 0,050 | 0,060 |
| 21.06.2026 | 5,02 | 4,30 | 2,43 | 2,34 | 5,35 | 5,54 | 5,70 | 5,56 | 4,91 | 4,25 | 2,28 | 0,030 |
| 20.06.2026 | 5,01 | 4,53 | 3,60 | 5,25 | 5,54 | 5,99 | 6,16 | 5,95 | 6,01 | 6,08 | 5,94 | 5,80 |
| 19.06.2026 | 5,76 | 3,64 | 4,55 | 5,72 | 5,93 | 6,18 | 6,29 | 6,26 | 6,18 | 6,52 | 6,20 | 5,69 |
| 18.06.2026 | 5,85 | 6,30 | 6,42 | 6,08 | 6,20 | 6,85 | 6,93 | 7,37 | 6,98 | 6,88 | 6,63 | 5,94 |
| 17.06.2026 | 5,34 | 4,85 | 5,10 | 5,66 | 6,30 | 6,63 | 6,39 | 6,79 | 6,43 | 6,49 | 6,98 | 6,51 |
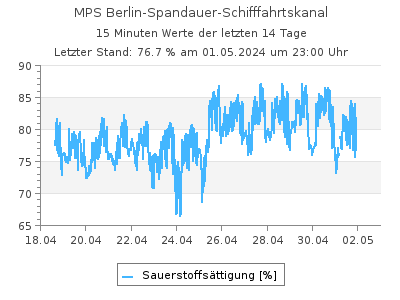
Aktuelle Werte Sauerstoffsättigung als Tabelle
Letzter Tagesmittelwert (23.06.2026): 0,450 %Werte Sauerstoffsättigung in % im Intervall von 2 Stunden (in MEZ), Quelle: Land Berlin
| 00:00 | 02:00 | 04:00 | 06:00 | 08:00 | 10:00 | 12:00 | 14:00 | 16:00 | 18:00 | 20:00 | 22:00 | |
|---|---|---|---|---|---|---|---|---|---|---|---|---|
| 24.06.2026 | 0,470 | - | - | - | - | - | - | - | - | - | - | - |
| 23.06.2026 | 0,350 | 0,350 | 0,460 | 0,810 | 0,350 | 0,460 | 0,350 | 1,06 | 0,470 | 0,360 | 0,350 | 0,470 |
| 22.06.2026 | 0,350 | 0,460 | 0,340 | 0,340 | 0,570 | 0,350 | 0,470 | 0,350 | 0,360 | 1,19 | 0,590 | 0,700 |
| 21.06.2026 | 57,9 | 49,6 | 28,0 | 26,9 | 61,8 | 64,3 | 65,7 | 64,1 | 56,7 | 49,1 | 26,4 | 0,350 |
| 20.06.2026 | 57,1 | 51,6 | 41,0 | 59,8 | 63,2 | 68,9 | 71,4 | 68,9 | 69,4 | 70,3 | 68,7 | 67,0 |
| 19.06.2026 | 63,8 | 40,3 | 50,4 | 63,3 | 65,9 | 69,3 | 71,0 | 71,0 | 70,8 | 75,1 | 71,0 | 65,0 |
| 18.06.2026 | 63,5 | 68,5 | 69,9 | 66,3 | 67,4 | 75,0 | 76,3 | 81,6 | 77,3 | 76,3 | 73,7 | 65,9 |
| 17.06.2026 | 56,6 | 51,3 | 53,8 | 59,6 | 66,6 | 70,5 | 68,5 | 73,4 | 70,1 | 70,5 | 76,0 | 70,6 |
| Messstellennummer | 601 |
|---|---|
| Messstellenname | MPS Berlin-Spandauer-Schifffahrtskanal |
| Gewässer | Berlin-Spandauer-Schifffahrtskanal |
| Betreiber | Land Berlin |
| Messstellenausprägung | Online-Messstelle |
| Flusskilometer | 9.08 |
| Rechtswert (UTM 33 N) | 387757.83 |
| Hochwert (UTM 33 N) | 5822226.26 |
Als Favorit speichern Als Favorit entfernen
Durch die Liste der Durchfluss-Messstellen blättern: