 DGS
DGS Leichte Sprache
MS Sophienwerder
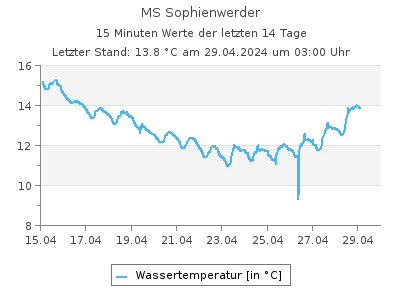
Aktuelle Wassertemperaturen als Tabelle
Letzter Tagesmittelwert (19.06.2025): 22,1 °CWassertemperaturen in °C im Intervall von 2 Stunden (in MEZ), Quelle: Land Berlin
| 00:00 | 02:00 | 04:00 | 06:00 | 08:00 | 10:00 | 12:00 | 14:00 | 16:00 | 18:00 | 20:00 | 22:00 | |
|---|---|---|---|---|---|---|---|---|---|---|---|---|
| 01.07.2025 | - | - | - | - | - | - | - | - | - | - | - | - |
| 30.06.2025 | - | 22,5 | 22,4 | 22,5 | 22,5 | 23,0 | 23,1 | 23,7 | 23,8 | 23,7 | 23,5 | 23,3 |
| 29.06.2025 | 22,4 | 22,4 | 22,3 | 22,4 | 22,7 | 22,8 | 22,8 | 23,0 | 23,3 | 23,1 | 22,9 | 22,7 |
| 28.06.2025 | 21,8 | 21,7 | 21,6 | 21,6 | 21,7 | 21,8 | 22,4 | 22,6 | 23,0 | 22,5 | 22,5 | 22,3 |
| 27.06.2025 | 22,2 | 22,2 | 22,2 | 22,3 | 22,3 | 22,3 | 22,2 | 22,3 | 22,3 | 22,2 | 22,1 | 21,9 |
| 26.06.2025 | 22,0 | 21,9 | 21,9 | 21,7 | 22,0 | 22,1 | 22,2 | 22,6 | 23,1 | 22,7 | 22,6 | 22,4 |
| 25.06.2025 | 21,9 | 21,9 | 21,8 | 21,7 | 21,7 | 21,8 | 21,9 | 22,1 | 22,3 | 22,1 | 22,1 | 22,0 |
| 24.06.2025 | 22,6 | 22,6 | 22,4 | 22,3 | 22,2 | 22,3 | 22,2 | 22,2 | 22,3 | 22,2 | 22,1 | 22,0 |
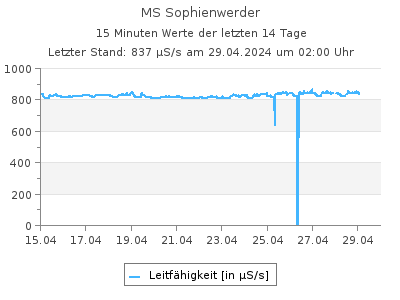
Aktuelle Leitfähigkeit als Tabelle
Letzter Tagesmittelwert (19.06.2025): 922 µS/sLeitfähigkeit in µS/s im Intervall von 2 Stunden (in MEZ), Quelle: Land Berlin
| 00:00 | 02:00 | 04:00 | 06:00 | 08:00 | 10:00 | 12:00 | 14:00 | 16:00 | 18:00 | 20:00 | 22:00 | |
|---|---|---|---|---|---|---|---|---|---|---|---|---|
| 01.07.2025 | - | - | - | - | - | - | - | - | - | - | - | - |
| 30.06.2025 | - | 953 | 927 | 1.007 | 947 | 924 | 913 | 923 | 946 | 943 | 938 | 935 |
| 29.06.2025 | 956 | 942 | 921 | 969 | 957 | 931 | 919 | 913 | 930 | 941 | 935 | 946 |
| 28.06.2025 | 915 | 932 | 923 | 924 | 916 | 902 | 901 | 890 | 900 | 925 | 917 | 928 |
| 27.06.2025 | 912 | 909 | 899 | 903 | 901 | 919 | 909 | 924 | 923 | 907 | 916 | 917 |
| 26.06.2025 | 896 | 883 | 896 | 911 | 899 | 895 | 899 | 903 | 904 | 906 | 909 | 903 |
| 25.06.2025 | 934 | 938 | 922 | 942 | 895 | 900 | 895 | 896 | 895 | 897 | 896 | 897 |
| 24.06.2025 | 912 | 934 | 917 | 913 | 925 | 925 | 898 | 923 | 937 | 930 | 926 | 944 |
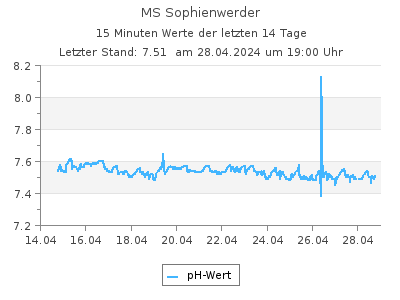
Aktuelle pH-Werte als Tabelle
Letzter Tagesmittelwert (19.06.2025): 7,43pH-Werte im Intervall von 2 Stunden (in MEZ), Quelle: Land Berlin
| 00:00 | 02:00 | 04:00 | 06:00 | 08:00 | 10:00 | 12:00 | 14:00 | 16:00 | 18:00 | 20:00 | 22:00 | |
|---|---|---|---|---|---|---|---|---|---|---|---|---|
| 01.07.2025 | - | - | - | - | - | - | - | - | - | - | - | - |
| 30.06.2025 | - | 7,50 | 7,59 | 7,37 | 7,53 | 7,69 | 7,74 | 7,73 | 7,64 | 7,65 | 7,64 | 7,65 |
| 29.06.2025 | 7,41 | 7,41 | 7,45 | 7,37 | 7,43 | 7,52 | 7,59 | 7,66 | 7,62 | 7,55 | 7,57 | 7,53 |
| 28.06.2025 | 7,60 | 7,50 | 7,54 | 7,48 | 7,50 | 7,57 | 7,62 | 7,66 | 7,68 | 7,55 | 7,55 | 7,48 |
| 27.06.2025 | 7,55 | 7,62 | 7,64 | 7,67 | 7,68 | 7,59 | 7,67 | 7,63 | 7,63 | 7,73 | 7,65 | 7,61 |
| 26.06.2025 | 7,74 | 7,73 | 7,70 | 7,44 | 7,59 | 7,71 | 7,70 | 7,65 | 7,64 | 7,60 | 7,59 | 7,54 |
| 25.06.2025 | 7,66 | 7,63 | 7,69 | 7,57 | 7,73 | 7,71 | 7,77 | 7,78 | 7,83 | 7,78 | 7,77 | 7,75 |
| 24.06.2025 | 7,70 | 7,61 | 7,63 | 7,64 | 7,62 | 7,66 | 7,82 | 7,76 | 7,72 | 7,69 | 7,72 | 7,63 |
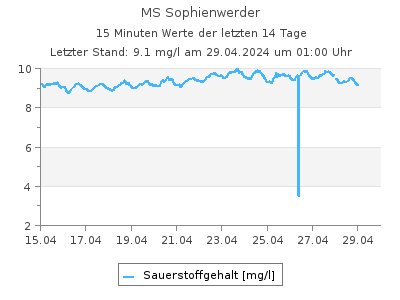
Aktuelle Sauerstoffgehalt-Werte als Tabelle
Letzter Tagesmittelwert (19.06.2025): 7,81 mg/lSauerstoffgehalt-Werte in mg/l im Intervall von 2 Stunden (in MEZ), Quelle: Land Berlin
| 00:00 | 02:00 | 04:00 | 06:00 | 08:00 | 10:00 | 12:00 | 14:00 | 16:00 | 18:00 | 20:00 | 22:00 | |
|---|---|---|---|---|---|---|---|---|---|---|---|---|
| 01.07.2025 | - | - | - | - | - | - | - | - | - | - | - | - |
| 30.06.2025 | - | 8,11 | 8,07 | 7,95 | 8,27 | 8,92 | 8,93 | 9,32 | 9,40 | 9,63 | 9,12 | 9,15 |
| 29.06.2025 | 7,69 | 7,30 | 7,13 | 7,52 | 8,02 | 8,13 | 8,28 | 8,66 | 9,01 | 8,46 | 8,50 | 8,20 |
| 28.06.2025 | 7,77 | 7,31 | 7,26 | 7,03 | 7,07 | 7,45 | 7,99 | 8,40 | 8,96 | 8,35 | 8,06 | 7,63 |
| 27.06.2025 | 7,12 | 7,38 | 7,17 | 7,33 | 7,42 | 7,41 | 7,66 | 8,01 | 8,13 | 8,30 | 8,10 | 7,83 |
| 26.06.2025 | 7,67 | 7,38 | 7,25 | 7,13 | 7,31 | 7,54 | 7,50 | 7,89 | 8,37 | 8,15 | 7,94 | 7,56 |
| 25.06.2025 | 8,09 | 8,01 | 7,86 | 7,50 | 7,75 | 7,48 | 7,95 | 8,08 | 8,48 | 8,08 | 7,94 | 7,89 |
| 24.06.2025 | 8,18 | 7,93 | 7,66 | 7,54 | 7,60 | 7,81 | 8,27 | 8,43 | 8,55 | 8,29 | 8,45 | 8,10 |
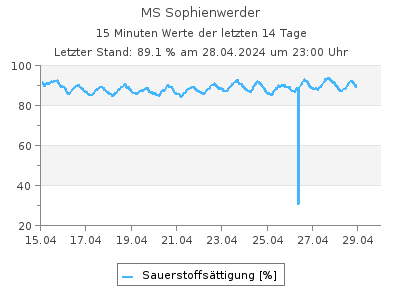
Aktuelle Werte Sauerstoffsättigung als Tabelle
Letzter Tagesmittelwert (28.06.2025): 89,4 %Werte Sauerstoffsättigung in % im Intervall von 2 Stunden (in MEZ), Quelle: Land Berlin
| 00:00 | 02:00 | 04:00 | 06:00 | 08:00 | 10:00 | 12:00 | 14:00 | 16:00 | 18:00 | 20:00 | 22:00 | |
|---|---|---|---|---|---|---|---|---|---|---|---|---|
| 01.07.2025 | - | - | - | - | - | - | - | - | - | - | - | - |
| 30.06.2025 | - | - | - | - | - | - | - | - | - | - | - | - |
| 29.06.2025 | 88,8 | 84,2 | 82,1 | 86,8 | 93,1 | 94,5 | 96,3 | 101 | 106 | 98,9 | 99,0 | 95,2 |
| 28.06.2025 | 88,7 | 83,3 | 82,6 | 79,9 | 80,5 | 85,0 | 92,1 | 97,2 | 104 | 96,6 | 93,1 | 87,9 |
| 27.06.2025 | 81,9 | 84,9 | 82,4 | 84,3 | 85,4 | 85,4 | 88,1 | 92,2 | 93,6 | 95,4 | 92,9 | 89,6 |
| 26.06.2025 | 87,8 | 84,3 | 82,8 | 81,3 | 83,6 | 86,5 | 86,2 | 91,3 | 97,9 | 94,5 | 91,9 | 87,3 |
| 25.06.2025 | 92,5 | 91,5 | 89,7 | 85,4 | 88,2 | 85,3 | 90,9 | 92,7 | 97,6 | 92,8 | 91,1 | 90,4 |
| 24.06.2025 | 94,8 | 91,8 | 88,4 | 86,8 | 87,4 | 89,9 | 95,1 | 97,0 | 98,4 | 95,3 | 97,0 | 92,8 |
| Messstellennummer | 161 |
|---|---|
| Messstellenname | MS Sophienwerder |
| Gewässer | Spree |
| Betreiber | Land Berlin |
| Messstellenausprägung | Messstation |
| Flusskilometer | 0.64 |
| Rechtswert (UTM 33 N) | 379020.21 |
| Hochwert (UTM 33 N) | 5822168.54 |
Als Favorit speichern Als Favorit entfernen
Durch die Liste der Wasserqualität-Messstellen blättern: