 DGS
DGS Leichte Sprache


MS Schmöckwitz
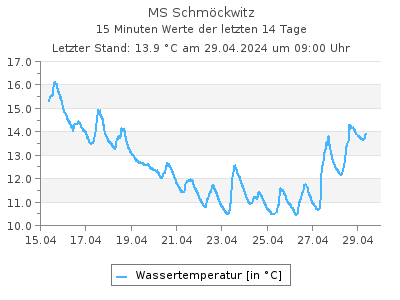
Aktuelle Wassertemperaturen als Tabelle
Letzter Tagesmittelwert (19.06.2025): 22,7 °CWassertemperaturen in °C im Intervall von 2 Stunden (in MEZ), Quelle: Land Berlin
| 00:00 | 02:00 | 04:00 | 06:00 | 08:00 | 10:00 | 12:00 | 14:00 | 16:00 | 18:00 | 20:00 | 22:00 | |
|---|---|---|---|---|---|---|---|---|---|---|---|---|
| 12.07.2025 | 21,7 | 21,6 | 21,5 | 21,4 | 21,3 | - | - | - | - | - | - | - |
| 11.07.2025 | 22,3 | 22,1 | 22,0 | 21,9 | 21,9 | 22,0 | 22,4 | 22,3 | 22,1 | 22,0 | 21,9 | 21,8 |
| 10.07.2025 | 22,2 | 22,1 | 22,0 | 21,9 | 21,9 | 22,2 | 22,5 | 22,5 | 22,9 | 22,8 | 22,7 | 22,5 |
| 09.07.2025 | 22,9 | 22,8 | 22,5 | 22,4 | 22,4 | 22,3 | 22,5 | 22,7 | 22,7 | 22,6 | 22,5 | 22,4 |
| 08.07.2025 | 23,3 | 23,2 | 22,9 | 22,8 | 22,7 | 22,7 | 23,0 | 23,3 | 23,6 | 23,4 | 23,2 | 23,0 |
| 07.07.2025 | 23,6 | 23,5 | 23,2 | 23,1 | 23,1 | 23,2 | 23,3 | 23,4 | 23,9 | 23,8 | 23,7 | 23,5 |
| 06.07.2025 | 23,9 | 23,8 | 23,6 | 23,5 | 23,6 | 23,9 | 24,3 | 24,4 | 24,3 | 24,1 | 23,9 | 23,7 |
| 05.07.2025 | 24,0 | 23,8 | 23,6 | 23,4 | 23,4 | 23,8 | 24,2 | 24,6 | 24,4 | 24,3 | 24,2 | 24,0 |
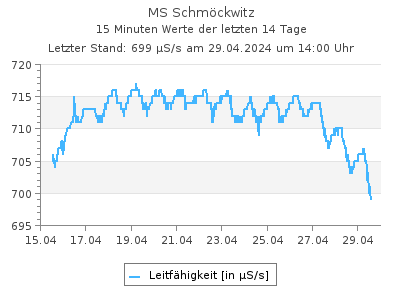
Aktuelle Leitfähigkeit als Tabelle
Letzter Tagesmittelwert (19.06.2025): 793 µS/sLeitfähigkeit in µS/s im Intervall von 2 Stunden (in MEZ), Quelle: Land Berlin
| 00:00 | 02:00 | 04:00 | 06:00 | 08:00 | 10:00 | 12:00 | 14:00 | 16:00 | 18:00 | 20:00 | 22:00 | |
|---|---|---|---|---|---|---|---|---|---|---|---|---|
| 12.07.2025 | 837 | 838 | 840 | 838 | 839 | - | - | - | - | - | - | - |
| 11.07.2025 | 840 | 841 | 844 | 843 | 844 | 843 | 842 | 840 | 821 | 832 | 839 | 838 |
| 10.07.2025 | 843 | 843 | 844 | 844 | 842 | 840 | 842 | 841 | 834 | 828 | 831 | 834 |
| 09.07.2025 | 784 | 815 | 815 | 800 | 822 | 829 | 816 | 820 | 837 | 838 | 808 | 841 |
| 08.07.2025 | 774 | 785 | 802 | 782 | 801 | 792 | 781 | 775 | 776 | 774 | 777 | 779 |
| 07.07.2025 | 781 | 786 | 785 | 780 | 780 | 767 | 779 | 792 | 778 | 783 | 781 | 780 |
| 06.07.2025 | 783 | 787 | 783 | 782 | 771 | 766 | 764 | 761 | 767 | 775 | 773 | 779 |
| 05.07.2025 | 803 | 802 | 809 | 805 | 798 | 776 | 769 | 771 | 775 | 778 | 777 | 782 |
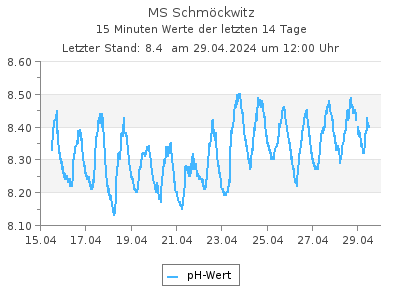
Aktuelle pH-Werte als Tabelle
Letzter Tagesmittelwert (19.06.2025): 8,20pH-Werte im Intervall von 2 Stunden (in MEZ), Quelle: Land Berlin
| 00:00 | 02:00 | 04:00 | 06:00 | 08:00 | 10:00 | 12:00 | 14:00 | 16:00 | 18:00 | 20:00 | 22:00 | |
|---|---|---|---|---|---|---|---|---|---|---|---|---|
| 12.07.2025 | 7,92 | 7,90 | 7,84 | 7,82 | 7,81 | - | - | - | - | - | - | - |
| 11.07.2025 | 7,94 | 7,90 | 7,84 | 7,82 | 7,84 | 7,90 | 7,97 | 7,99 | 8,24 | 8,06 | 7,95 | 7,91 |
| 10.07.2025 | 7,88 | 7,88 | 7,85 | 7,85 | 7,88 | 7,97 | 7,96 | 7,97 | 8,18 | 8,25 | 8,16 | 8,08 |
| 09.07.2025 | 8,55 | 8,26 | 8,19 | 8,34 | 8,14 | 8,05 | 8,30 | 8,28 | 8,05 | 8,06 | 8,39 | 7,93 |
| 08.07.2025 | 8,50 | 8,39 | 8,18 | 8,34 | 8,19 | 8,36 | 8,51 | 8,62 | 8,67 | 8,74 | 8,70 | 8,64 |
| 07.07.2025 | 8,23 | 8,13 | 8,09 | 8,14 | 8,12 | 8,32 | 8,41 | 8,36 | 8,50 | 8,51 | 8,55 | 8,48 |
| 06.07.2025 | 8,29 | 8,23 | 8,23 | 8,22 | 8,33 | 8,43 | 8,43 | 8,47 | 8,42 | 8,36 | 8,36 | 8,30 |
| 05.07.2025 | 8,16 | 8,12 | 8,05 | 8,03 | 8,12 | 8,35 | 8,41 | 8,44 | 8,40 | 8,44 | 8,39 | 8,34 |
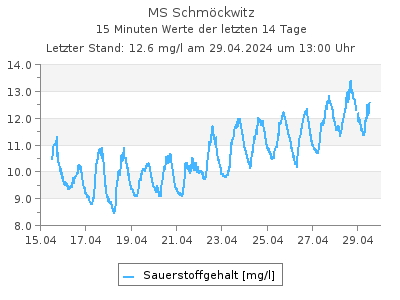
Aktuelle Sauerstoffgehalt-Werte als Tabelle
Letzter Tagesmittelwert (19.06.2025): 8,77 mg/lSauerstoffgehalt-Werte in mg/l im Intervall von 2 Stunden (in MEZ), Quelle: Land Berlin
| 00:00 | 02:00 | 04:00 | 06:00 | 08:00 | 10:00 | 12:00 | 14:00 | 16:00 | 18:00 | 20:00 | 22:00 | |
|---|---|---|---|---|---|---|---|---|---|---|---|---|
| 12.07.2025 | 6,96 | 6,74 | 6,29 | 6,08 | 6,06 | - | - | - | - | - | - | - |
| 11.07.2025 | 6,87 | 6,57 | 6,05 | 5,90 | 6,20 | 6,72 | 7,50 | 7,55 | 8,84 | 7,81 | 7,19 | 6,84 |
| 10.07.2025 | 6,40 | 6,37 | 6,10 | 6,06 | 6,38 | 7,16 | 7,15 | 7,33 | 8,81 | 9,09 | 8,41 | 7,84 |
| 09.07.2025 | 10,0 | 8,43 | 7,74 | 8,44 | 7,71 | 7,23 | 8,94 | 8,89 | 7,61 | 7,71 | 9,53 | 6,81 |
| 08.07.2025 | 9,54 | 8,72 | 7,32 | 8,08 | 7,52 | 8,70 | 9,86 | 11,0 | 11,4 | 12,1 | 11,7 | 11,0 |
| 07.07.2025 | 7,65 | 7,01 | 6,56 | 6,84 | 6,72 | 8,05 | 8,93 | 8,72 | 9,93 | 9,94 | 10,4 | 9,58 |
| 06.07.2025 | 8,17 | 7,77 | 7,64 | 7,62 | 8,06 | 8,97 | 9,04 | 9,27 | 8,85 | 8,54 | 8,47 | 8,18 |
| 05.07.2025 | 7,72 | 7,38 | 6,91 | 6,64 | 7,24 | 8,68 | 8,96 | 9,30 | 8,97 | 9,43 | 8,73 | 8,52 |
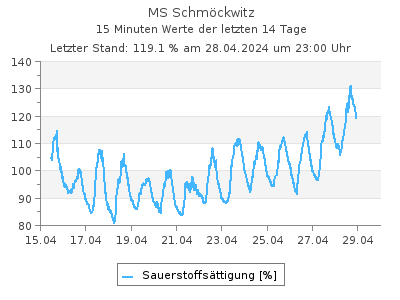
Aktuelle Werte Sauerstoffsättigung als Tabelle
Letzter Tagesmittelwert (11.07.2025): 80,7 %Werte Sauerstoffsättigung in % im Intervall von 2 Stunden (in MEZ), Quelle: Land Berlin
| 00:00 | 02:00 | 04:00 | 06:00 | 08:00 | 10:00 | 12:00 | 14:00 | 16:00 | 18:00 | 20:00 | 22:00 | |
|---|---|---|---|---|---|---|---|---|---|---|---|---|
| 12.07.2025 | 79,3 | - | - | - | - | - | - | - | - | - | - | - |
| 11.07.2025 | 79,1 | 75,4 | 69,3 | 67,4 | 70,9 | 77,0 | 86,5 | 86,9 | 101 | 89,5 | 82,2 | 78,0 |
| 10.07.2025 | 73,6 | 73,1 | 69,9 | 69,3 | 73,0 | 82,4 | 82,6 | 84,8 | 103 | 106 | 97,5 | 90,6 |
| 09.07.2025 | 116 | 97,9 | 89,5 | 97,3 | 88,9 | 83,2 | 103 | 103 | 88,3 | 89,3 | 110 | 78,6 |
| 08.07.2025 | 112 | 102 | 85,2 | 93,9 | 87,2 | 101 | 115 | 129 | 135 | 143 | 137 | 128 |
| 07.07.2025 | 90,3 | 82,5 | 76,9 | 80,0 | 78,5 | 94,3 | 105 | 103 | 118 | 118 | 123 | 113 |
| 06.07.2025 | 96,9 | 92,0 | 90,2 | 89,8 | 95,2 | 106 | 108 | 111 | 106 | 102 | 100 | 96,8 |
| 05.07.2025 | 91,8 | 87,4 | 81,5 | 78,0 | 85,1 | 103 | 107 | 112 | 107 | 113 | 104 | 101 |
| Messstellennummer | 211 |
|---|---|
| Messstellenname | MS Schmöckwitz |
| Gewässer | Dahme |
| Betreiber | Land Berlin |
| Messstellenausprägung | Messstation |
| Flusskilometer | 0.29 |
| Rechtswert (UTM 33 N) | 408335.31 |
| Hochwert (UTM 33 N) | 5803523.72 |
Als Favorit speichern Als Favorit entfernen
Durch die Liste der Wasserqualität-Messstellen blättern: