 DGS
DGS Leichte Sprache

Eisstadion
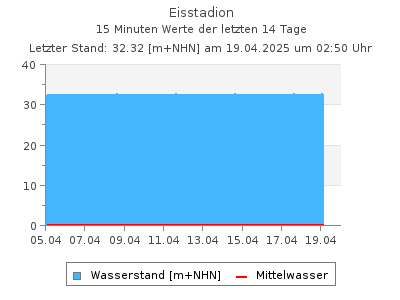
Aktuelle Wasserstände als Tabelle
Letzter Tagesmittelwert (11.07.2026): 36,3 cmWasserstände W in cm im Intervall von 2 Stunden (in MEZ), Quelle: Land Berlin
| 00:00 | 02:00 | 04:00 | 06:00 | 08:00 | 10:00 | 12:00 | 14:00 | 16:00 | 18:00 | 20:00 | 22:00 | |
|---|---|---|---|---|---|---|---|---|---|---|---|---|
| 11.07.2026 | 36,3 | 36,4 | 36,4 | 36,5 | - | - | - | - | - | - | - | - |
| 10.07.2026 | 36,6 | 36,7 | 9,70 | 30,3 | 34,2 | 33,8 | 33,6 | 33,0 | 36,3 | 36,1 | 36,0 | 36,1 |
| 09.07.2026 | 36,4 | 36,6 | 9,40 | 31,5 | 33,7 | 33,9 | 33,8 | 33,6 | 36,7 | 36,5 | 36,4 | 36,6 |
| 08.07.2026 | 45,9 | 46,0 | 18,2 | 41,5 | 43,0 | 34,2 | 34,1 | 34,0 | 36,7 | 36,4 | 36,3 | 36,5 |
| 07.07.2026 | 47,1 | 47,1 | 21,1 | 43,9 | 43,7 | 43,6 | 43,5 | 43,2 | 46,1 | 45,9 | 45,8 | 46,0 |
| 06.07.2026 | 45,7 | 45,8 | 46,1 | 45,9 | 45,7 | 10,8 | 42,5 | 44,3 | 53,4 | 54,9 | 48,6 | 47,2 |
| 05.07.2026 | 46,9 | 46,2 | 45,9 | 46,0 | 46,6 | 47,0 | 46,1 | 45,8 | 45,6 | 45,7 | 45,5 | 45,6 |
| 04.07.2026 | 45,2 | 45,4 | 45,4 | 45,6 | 45,4 | 45,4 | 45,4 | 45,5 | 45,4 | 45,3 | 45,4 | 47,1 |
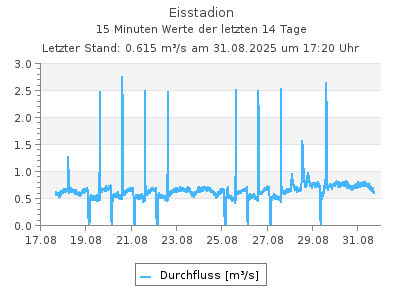
Aktuelle Abflüsse als Tabelle
Letzter Tagesmittelwert (11.07.2026): 0,500 m3/sAbflüsse Q in mł/s im Intervall von 2 Stunden (in MEZ), Quelle: Land Berlin
| 00:00 | 02:00 | 04:00 | 06:00 | 08:00 | 10:00 | 12:00 | 14:00 | 16:00 | 18:00 | 20:00 | 22:00 | |
|---|---|---|---|---|---|---|---|---|---|---|---|---|
| 11.07.2026 | - | 0,494 | 0,444 | 0,462 | - | - | - | - | - | - | - | - |
| 10.07.2026 | 0,509 | 0,516 | 0,040 | 0,323 | 0,394 | 0,400 | 0,382 | 0,380 | 0,478 | 0,491 | 0,511 | 0,504 |
| 09.07.2026 | 0,507 | 0,513 | 0,082 | 0,329 | 0,390 | 0,393 | 0,393 | 0,338 | 0,505 | 0,518 | 0,505 | 0,510 |
| 08.07.2026 | 0,460 | 0,473 | 0,032 | 0,342 | 0,355 | 0,353 | 0,321 | 0,342 | 0,535 | 0,544 | 0,540 | 0,523 |
| 07.07.2026 | 0,540 | 0,568 | 0,091 | 0,393 | 0,399 | 0,387 | 0,402 | 0,366 | 0,534 | 0,523 | 0,507 | 0,508 |
| 06.07.2026 | 0,479 | 0,503 | 0,554 | 0,535 | 0,494 | 0,008 | 0,331 | 0,460 | 1,05 | 1,11 | 0,637 | 0,552 |
| 05.07.2026 | 0,614 | 0,554 | 0,515 | 0,520 | 0,567 | 0,558 | 0,522 | 0,514 | 0,502 | 0,495 | 0,512 | 0,494 |
| 04.07.2026 | 0,469 | 0,502 | 0,483 | 0,501 | 0,514 | 0,520 | 0,470 | 0,535 | 0,496 | 0,459 | 0,515 | 0,617 |
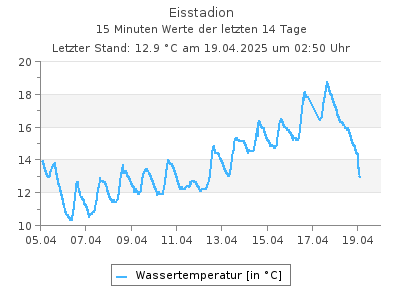
Aktuelle Wassertemperaturen als Tabelle
Letzter Tagesmittelwert (11.07.2026): 20,4 °CWassertemperaturen in °C im Intervall von 2 Stunden (in MEZ), Quelle: Land Berlin
| 00:00 | 02:00 | 04:00 | 06:00 | 08:00 | 10:00 | 12:00 | 14:00 | 16:00 | 18:00 | 20:00 | 22:00 | |
|---|---|---|---|---|---|---|---|---|---|---|---|---|
| 11.07.2026 | 20,4 | 20,0 | 19,6 | 19,2 | - | - | - | - | - | - | - | - |
| 10.07.2026 | - | 19,5 | 19,1 | 19,1 | 19,0 | 19,3 | 20,0 | 20,9 | 21,9 | 21,6 | 21,1 | 20,8 |
| 09.07.2026 | 19,0 | 18,8 | 18,2 | 18,2 | 18,2 | 18,3 | 19,1 | 20,1 | 21,3 | 20,5 | 19,9 | 19,9 |
| 08.07.2026 | 18,7 | 18,3 | 17,7 | 17,7 | 17,6 | 17,8 | 18,6 | 19,5 | 20,1 | 19,6 | 19,2 | 19,1 |
| 07.07.2026 | 19,0 | 18,9 | 18,8 | 18,8 | 18,9 | 19,1 | 19,3 | 19,6 | 19,8 | 19,6 | 19,4 | 19,1 |
| 06.07.2026 | 19,2 | 19,0 | 18,7 | 18,5 | 18,6 | 19,0 | 18,9 | 19,0 | 19,1 | 19,0 | 18,9 | 18,9 |
| 05.07.2026 | 18,6 | 18,4 | 18,3 | 18,4 | 18,6 | 19,0 | 19,4 | 20,1 | 20,5 | 20,1 | 19,7 | 19,4 |
| 04.07.2026 | 19,0 | 18,7 | 18,3 | 18,1 | 18,2 | 18,5 | 18,9 | 19,0 | 19,1 | 19,0 | 18,8 | 18,7 |
| Messstellennummer | 5867601 |
|---|---|
| Messstellenname | Eisstadion |
| Gewässer | Panke |
| Betreiber | Land Berlin |
| Messstellenausprägung | Wasserstand und Durchfluss |
| Flusskilometer | |
| Pegelnullpunkt (m +NHN) | 31.85 |
| Rechtswert (UTM 33 N) | 389447.20 |
| Hochwert (UTM 33 N) | 5822141.23 |
Für diese Station sind keine Hauptwerte vorhanden
Als Favorit speichern Als Favorit entfernen
Durch die Liste der Wassertemperatur-Messstellen blättern: