 DGS
DGS Leichte Sprache


MS Rahnsdorf
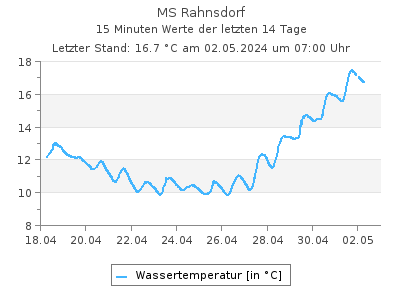
Aktuelle Wassertemperaturen als Tabelle
Letzter Tagesmittelwert (05.07.2026): 20,7 °CWassertemperaturen in °C im Intervall von 2 Stunden (in MEZ), Quelle: Land Berlin
| 00:00 | 02:00 | 04:00 | 06:00 | 08:00 | 10:00 | 12:00 | 14:00 | 16:00 | 18:00 | 20:00 | 22:00 | |
|---|---|---|---|---|---|---|---|---|---|---|---|---|
| 02.08.2026 | - | 22,2 | 22,1 | 22,1 | 22,1 | 22,1 | 22,5 | 22,7 | 23,0 | 23,0 | 22,9 | - |
| 01.08.2026 | 23,3 | 23,3 | 23,1 | 23,0 | 22,9 | 22,8 | 22,7 | 22,6 | 22,6 | 22,7 | 22,6 | 22,5 |
| 31.07.2026 | 22,7 | 22,7 | 22,7 | 22,6 | 22,7 | 22,8 | 23,2 | 23,4 | 23,6 | 23,7 | 23,6 | 23,5 |
| 30.07.2026 | 21,2 | 21,1 | 21,0 | 20,9 | 21,0 | 21,3 | 21,7 | 22,1 | 22,6 | 22,9 | 22,9 | 22,8 |
| 29.07.2026 | 20,4 | 20,2 | 20,1 | 20,0 | 20,0 | 20,2 | 20,6 | 20,9 | 21,3 | 21,5 | 21,4 | 21,4 |
| 28.07.2026 | 20,1 | 20,0 | 19,9 | 19,8 | 19,9 | 20,1 | 20,4 | 20,7 | 20,8 | 20,7 | 20,6 | 20,5 |
| 27.07.2026 | 20,3 | 20,2 | 20,1 | 20,0 | 19,9 | 20,1 | 20,3 | 20,5 | 20,7 | 20,5 | 20,4 | 20,2 |
| 26.07.2026 | 20,4 | 20,3 | 20,1 | 20,0 | 20,0 | 20,2 | 20,3 | 20,5 | 20,5 | 20,5 | 20,5 | 20,4 |
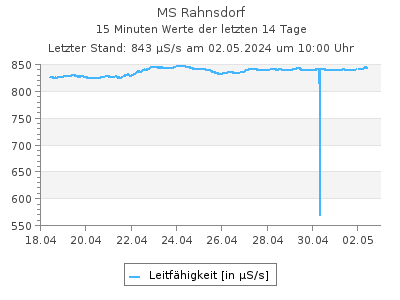
Aktuelle Leitfähigkeit als Tabelle
Letzter Tagesmittelwert (01.08.2026): 900 µS/sLeitfähigkeit in µS/s im Intervall von 2 Stunden (in MEZ), Quelle: Land Berlin
| 00:00 | 02:00 | 04:00 | 06:00 | 08:00 | 10:00 | 12:00 | 14:00 | 16:00 | 18:00 | 20:00 | 22:00 | |
|---|---|---|---|---|---|---|---|---|---|---|---|---|
| 02.08.2026 | - | 903 | 905 | 904 | 904 | 905 | 905 | 906 | 907 | 907 | 909 | - |
| 01.08.2026 | 901 | 901 | 902 | 902 | 894 | 898 | 897 | 898 | 899 | 901 | 902 | 902 |
| 31.07.2026 | 893 | 894 | 895 | 896 | 897 | 898 | 899 | 899 | 900 | 900 | 900 | 900 |
| 30.07.2026 | 895 | 894 | 894 | 894 | 894 | 894 | 893 | 893 | 892 | 892 | 893 | 893 |
| 29.07.2026 | 892 | 893 | 895 | 897 | 898 | 898 | 898 | 897 | 896 | 894 | 894 | 894 |
| 28.07.2026 | 891 | 891 | 891 | 891 | 891 | 891 | 890 | 890 | 889 | 890 | 891 | 892 |
| 27.07.2026 | 893 | 890 | 892 | 892 | 892 | 884 | 880 | 884 | 882 | 888 | 887 | 890 |
| 26.07.2026 | 902 | 902 | 903 | 902 | 901 | 900 | 898 | 898 | 897 | 897 | 896 | 897 |
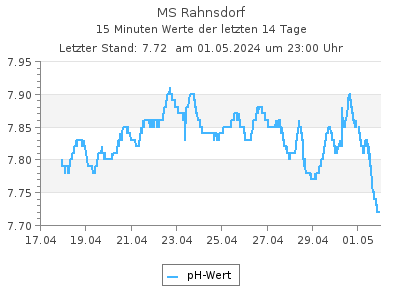
Aktuelle pH-Werte als Tabelle
Letzter Tagesmittelwert (05.07.2026): 7,60pH-Werte im Intervall von 2 Stunden (in MEZ), Quelle: Land Berlin
| 00:00 | 02:00 | 04:00 | 06:00 | 08:00 | 10:00 | 12:00 | 14:00 | 16:00 | 18:00 | 20:00 | 22:00 | |
|---|---|---|---|---|---|---|---|---|---|---|---|---|
| 02.08.2026 | - | 7,51 | 7,53 | 7,51 | 7,49 | 7,47 | 7,45 | 7,44 | 7,46 | 7,45 | 7,44 | - |
| 01.08.2026 | 7,52 | 7,53 | 7,52 | 7,51 | 7,52 | 7,52 | 7,51 | 7,50 | 7,49 | 7,48 | 7,47 | 7,47 |
| 31.07.2026 | 7,60 | 7,60 | 7,58 | 7,57 | 7,58 | 7,58 | 7,60 | 7,61 | 7,59 | 7,59 | 7,54 | 7,52 |
| 30.07.2026 | 7,61 | 7,60 | 7,59 | 7,58 | 7,58 | 7,61 | 7,61 | 7,61 | 7,64 | 7,66 | 7,66 | 7,61 |
| 29.07.2026 | 7,57 | 7,57 | 7,55 | 7,54 | 7,54 | 7,54 | 7,57 | 7,59 | 7,64 | 7,64 | 7,62 | 7,61 |
| 28.07.2026 | 7,66 | 7,65 | 7,63 | 7,61 | 7,61 | 7,64 | 7,65 | 7,65 | 7,66 | 7,64 | 7,60 | 7,57 |
| 27.07.2026 | 7,45 | 7,46 | 7,46 | 7,45 | 7,46 | 7,48 | 7,53 | 7,56 | 7,62 | 7,62 | 7,64 | 7,66 |
| 26.07.2026 | 7,40 | 7,41 | 7,41 | 7,41 | 7,43 | 7,45 | 7,47 | 7,46 | 7,46 | 7,46 | 7,44 | 7,44 |
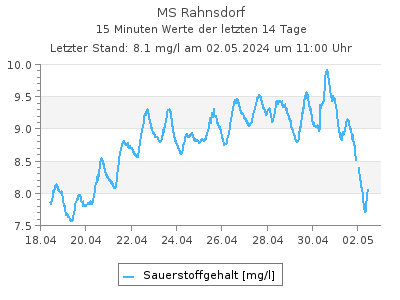
Aktuelle Sauerstoffgehalt-Werte als Tabelle
Letzter Tagesmittelwert (05.07.2026): 5,92 mg/lSauerstoffgehalt-Werte in mg/l im Intervall von 2 Stunden (in MEZ), Quelle: Land Berlin
| 00:00 | 02:00 | 04:00 | 06:00 | 08:00 | 10:00 | 12:00 | 14:00 | 16:00 | 18:00 | 20:00 | 22:00 | |
|---|---|---|---|---|---|---|---|---|---|---|---|---|
| 02.08.2026 | - | 5,43 | 5,45 | 5,16 | 4,80 | 4,72 | 4,85 | 5,12 | 5,58 | 5,76 | 5,65 | - |
| 01.08.2026 | 6,30 | 6,31 | 5,98 | 5,71 | 5,77 | 5,78 | 5,65 | 5,51 | 5,47 | 5,50 | 5,34 | 5,27 |
| 31.07.2026 | 7,20 | 7,03 | 6,72 | 6,54 | 6,62 | 6,68 | 7,10 | 7,33 | 7,34 | 7,39 | 6,85 | 6,57 |
| 30.07.2026 | 6,58 | 6,46 | 6,33 | 6,24 | 6,22 | 6,45 | 6,77 | 6,96 | 7,40 | 7,72 | 7,69 | 7,28 |
| 29.07.2026 | 5,73 | 5,58 | 5,34 | 5,14 | 5,05 | 5,13 | 5,59 | 6,05 | 6,72 | 6,93 | 6,79 | 6,65 |
| 28.07.2026 | 7,16 | 6,91 | 6,52 | 6,25 | 6,24 | 6,61 | 6,86 | 6,95 | 7,04 | 6,76 | 6,24 | 5,90 |
| 27.07.2026 | 6,17 | 6,15 | 5,97 | 5,90 | 5,91 | 6,07 | 6,67 | 7,00 | 7,53 | 7,33 | 7,43 | 7,31 |
| 26.07.2026 | 5,66 | 5,68 | 5,62 | 5,59 | 5,85 | 6,11 | 6,42 | 6,51 | 6,48 | 6,53 | 6,26 | 6,13 |
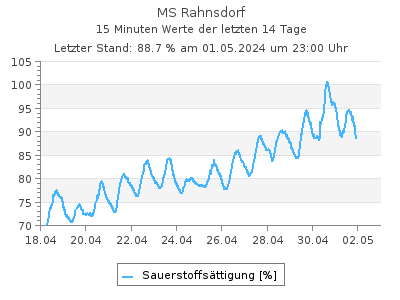
Aktuelle Werte Sauerstoffsättigung als Tabelle
Letzter Tagesmittelwert (31.07.2026): 80,8 %Werte Sauerstoffsättigung in % im Intervall von 2 Stunden (in MEZ), Quelle: Land Berlin
| 00:00 | 02:00 | 04:00 | 06:00 | 08:00 | 10:00 | 12:00 | 14:00 | 16:00 | 18:00 | 20:00 | 22:00 | |
|---|---|---|---|---|---|---|---|---|---|---|---|---|
| 02.08.2026 | - | - | - | - | - | - | - | - | - | - | - | - |
| 01.08.2026 | 74,0 | 74,0 | 69,9 | 66,6 | 67,2 | 67,2 | 65,6 | 63,9 | 63,4 | 63,8 | 61,8 | 60,9 |
| 31.07.2026 | 83,6 | 81,7 | 77,9 | 75,7 | 76,8 | 77,7 | 83,1 | 86,2 | 86,6 | 87,3 | 80,8 | 77,4 |
| 30.07.2026 | 74,3 | 72,7 | 71,1 | 69,9 | 69,8 | 72,8 | 77,1 | 79,9 | 85,8 | 89,9 | 89,6 | 84,7 |
| 29.07.2026 | 63,6 | 61,8 | 58,9 | 56,6 | 55,7 | 56,7 | 62,3 | 67,8 | 75,9 | 78,6 | 76,9 | 75,2 |
| 28.07.2026 | 79,1 | 76,1 | 71,6 | 68,6 | 68,5 | 72,9 | 76,1 | 77,6 | 78,7 | 75,6 | 69,6 | 65,6 |
| 27.07.2026 | 68,3 | 68,0 | 65,9 | 65,0 | 65,0 | 67,0 | 74,0 | 77,8 | 84,1 | 81,6 | 82,4 | 80,9 |
| 26.07.2026 | 62,9 | 63,0 | 62,1 | 61,6 | 64,5 | 67,6 | 71,2 | 72,4 | 72,1 | 72,7 | 69,6 | 68,1 |
| Messstellennummer | 111 |
|---|---|
| Messstellenname | MS Rahnsdorf |
| Gewässer | Müggelspree |
| Betreiber | Land Berlin |
| Messstellenausprägung | Messstation |
| Flusskilometer | 8.51 |
| Rechtswert (UTM 33 N) | 410862.07 |
| Hochwert (UTM 33 N) | 5809644.52 |
Als Favorit speichern Als Favorit entfernen
Durch die Liste der Wassertemperatur-Messstellen blättern: