 DGS
DGS Leichte Sprache
Eisstadion
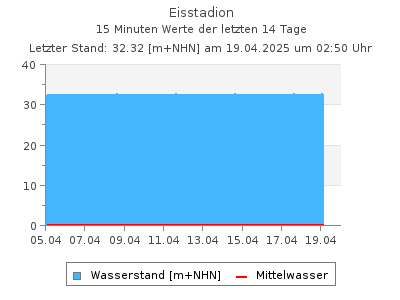
Aktuelle Wasserstõnde als Tabelle
Letzter Tagesmittelwert (02.05.2026): 38,3 cmWasserstõnde W in cm im Intervall von 2 Stunden (in MEZ), Quelle: Land Berlin
| 00:00 | 02:00 | 04:00 | 06:00 | 08:00 | 10:00 | 12:00 | 14:00 | 16:00 | 18:00 | 20:00 | 22:00 | |
|---|---|---|---|---|---|---|---|---|---|---|---|---|
| 03.05.2026 | - | - | - | - | - | - | - | - | - | - | - | - |
| 02.05.2026 | - | 38,0 | 37,9 | 37,8 | 38,0 | 38,0 | 37,8 | 37,4 | 37,0 | 37,3 | 37,9 | 38,1 |
| 01.05.2026 | 38,4 | 38,4 | 38,4 | 38,9 | 38,3 | 38,2 | 37,9 | 37,6 | 37,4 | 38,1 | 38,2 | 38,2 |
| 30.04.2026 | 38,7 | 38,4 | 9,30 | 36,5 | 36,2 | 36,1 | 35,9 | 35,3 | 38,2 | 38,5 | 38,6 | 38,4 |
| 29.04.2026 | 39,1 | 39,1 | 9,60 | 36,8 | 36,2 | 36,2 | 36,2 | 35,7 | 38,8 | 39,2 | 38,7 | 38,8 |
| 28.04.2026 | 39,2 | 39,3 | 9,10 | 37,0 | 36,8 | 36,6 | 36,1 | 35,8 | 39,0 | 39,3 | 39,3 | 39,2 |
| 27.04.2026 | 39,5 | 39,3 | 9,70 | 37,0 | 37,1 | 36,6 | 36,7 | 36,5 | 39,4 | 39,5 | 39,3 | 39,3 |
| 26.04.2026 | 39,3 | 39,2 | 39,2 | 39,3 | 39,3 | 39,3 | 38,9 | 38,7 | 38,4 | 38,9 | 39,2 | 39,4 |
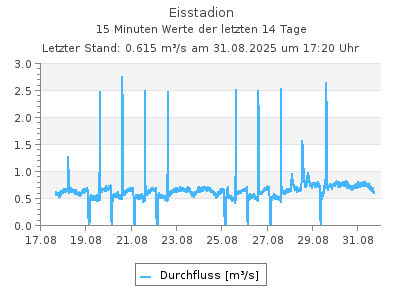
Aktuelle Abfl³sse als Tabelle
Letzter Tagesmittelwert (02.05.2026): 0,670 m3/sAbfl³sse Q in m│/s im Intervall von 2 Stunden (in MEZ), Quelle: Land Berlin
| 00:00 | 02:00 | 04:00 | 06:00 | 08:00 | 10:00 | 12:00 | 14:00 | 16:00 | 18:00 | 20:00 | 22:00 | |
|---|---|---|---|---|---|---|---|---|---|---|---|---|
| 03.05.2026 | - | - | - | - | - | - | - | - | - | - | - | - |
| 02.05.2026 | - | 0,661 | 0,647 | 0,639 | 0,668 | 0,662 | 0,631 | 0,622 | 0,582 | 0,632 | 0,705 | 0,665 |
| 01.05.2026 | 0,663 | 0,640 | 0,686 | 0,658 | 0,635 | 0,651 | 0,667 | 0,642 | 0,646 | 0,656 | 0,681 | 0,705 |
| 30.04.2026 | 0,658 | 0,656 | 0,065 | 0,535 | 0,513 | 0,494 | 0,495 | 0,452 | 0,677 | 0,707 | 0,698 | 0,644 |
| 29.04.2026 | 0,700 | 0,684 | 0,051 | 0,530 | 0,521 | 0,506 | 0,488 | 0,494 | 0,661 | 0,662 | 0,671 | 0,657 |
| 28.04.2026 | 0,727 | 0,723 | 0,028 | 0,567 | 0,510 | 0,530 | 0,511 | 0,496 | 0,752 | 0,728 | 0,713 | 0,702 |
| 27.04.2026 | 0,677 | 0,697 | 0,019 | 0,546 | 0,543 | 0,501 | 0,500 | 0,506 | 0,759 | 0,769 | 0,716 | 0,737 |
| 26.04.2026 | 0,715 | 0,741 | 0,720 | 0,750 | 0,715 | 0,718 | 0,682 | 0,654 | 0,658 | 0,713 | 0,720 | 0,724 |
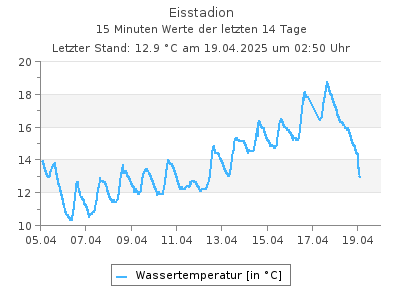
Aktuelle Wassertemperaturen als Tabelle
Letzter Tagesmittelwert (02.05.2026): 15,7 ░CWassertemperaturen in ░C im Intervall von 2 Stunden (in MEZ), Quelle: Land Berlin
| 00:00 | 02:00 | 04:00 | 06:00 | 08:00 | 10:00 | 12:00 | 14:00 | 16:00 | 18:00 | 20:00 | 22:00 | |
|---|---|---|---|---|---|---|---|---|---|---|---|---|
| 03.05.2026 | - | - | - | - | - | - | - | - | - | - | - | - |
| 02.05.2026 | - | 15,3 | 14,7 | 14,4 | 14,2 | 14,5 | 15,9 | 17,4 | 18,3 | 17,4 | 16,9 | 16,9 |
| 01.05.2026 | 14,4 | 14,0 | 13,6 | 13,2 | 13,1 | 13,6 | 15,0 | 16,5 | 17,2 | 16,3 | 16,1 | 16,0 |
| 30.04.2026 | 13,1 | 12,6 | 11,9 | 12,0 | 11,9 | 11,8 | 12,6 | 14,0 | 15,3 | 14,8 | 14,6 | 14,7 |
| 29.04.2026 | 13,2 | 12,7 | 11,9 | 11,9 | 11,6 | 11,6 | 12,3 | 13,4 | 14,6 | 13,7 | 13,5 | 13,4 |
| 28.04.2026 | 13,4 | 12,9 | 12,1 | 12,2 | 11,9 | 11,9 | 12,5 | 13,6 | 14,7 | 13,8 | 13,6 | 13,5 |
| 27.04.2026 | 13,0 | 12,6 | 11,8 | 11,9 | 11,6 | 11,6 | 12,4 | 13,5 | 14,6 | 14,2 | 13,9 | 13,7 |
| 26.04.2026 | 12,9 | 12,4 | 11,9 | 11,5 | 11,3 | 11,8 | 12,9 | 14,1 | 14,6 | 13,7 | 13,4 | 13,3 |
| Messstellennummer | 5867601 |
|---|---|
| Messstellenname | Eisstadion |
| Gewõsser | Panke |
| Betreiber | Land Berlin |
| Messstellenausprõgung | Wasserstand und Durchfluss |
| Flusskilometer | |
| Pegelnullpunkt (m +NHN) | 31.85 |
| Rechtswert (UTM 33 N) | 389447.20 |
| Hochwert (UTM 33 N) | 5822141.23 |
F³r diese Station sind keine Hauptwerte vorhanden
Als Favorit speichern Als Favorit entfernen
Durch die Liste der Wassertemperatur-Messstellen blõttern: