 DGS
DGS Leichte Sprache
Eisstadion
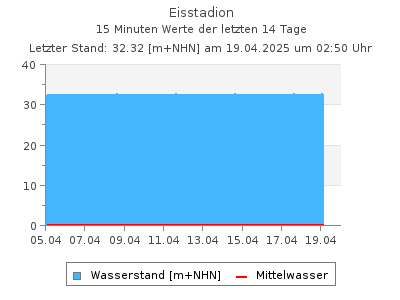
Aktuelle Wasserstände als Tabelle
Letzter Tagesmittelwert (24.07.2026): 35,1 cmWasserstände W in cm im Intervall von 2 Stunden (in MEZ), Quelle: Land Berlin
| 00:00 | 02:00 | 04:00 | 06:00 | 08:00 | 10:00 | 12:00 | 14:00 | 16:00 | 18:00 | 20:00 | 22:00 | |
|---|---|---|---|---|---|---|---|---|---|---|---|---|
| 25.07.2026 | 36,8 | 36,9 | 36,7 | 36,7 | - | - | - | - | - | - | - | - |
| 24.07.2026 | 38,9 | 38,2 | 12,4 | 36,9 | 35,8 | 36,2 | 35,1 | 34,4 | 37,5 | 37,2 | 37,3 | 36,8 |
| 23.07.2026 | 36,2 | 36,4 | 11,4 | 33,6 | 33,8 | 33,8 | 33,6 | 33,5 | 51,1 | 43,4 | 41,6 | 39,9 |
| 22.07.2026 | - | 36,1 | 10,7 | 29,2 | 33,1 | 33,4 | 33,3 | 32,8 | 36,5 | 35,7 | 36,0 | 36,1 |
| 21.07.2026 | 35,6 | 35,7 | 8,20 | 29,7 | 32,6 | 32,8 | 32,9 | 32,9 | 36,1 | 35,6 | 35,6 | 35,7 |
| 20.07.2026 | 35,5 | 35,5 | 9,70 | 22,4 | 33,2 | 32,8 | 32,5 | 32,3 | 36,0 | 35,6 | 35,4 | 35,6 |
| 19.07.2026 | 35,2 | 35,4 | 35,6 | 35,4 | 35,4 | 35,3 | 35,2 | 35,3 | 35,1 | 35,3 | 37,3 | 36,1 |
| 18.07.2026 | 41,1 | 43,4 | 38,0 | 36,5 | 36,1 | 35,9 | 36,1 | 35,6 | 35,4 | 35,2 | 35,1 | 35,2 |
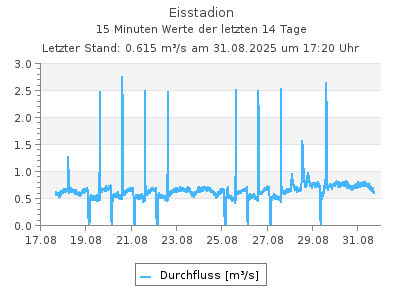
Aktuelle Abflüsse als Tabelle
Letzter Tagesmittelwert (25.07.2026): 0,520 m3/sAbflüsse Q in mł/s im Intervall von 2 Stunden (in MEZ), Quelle: Land Berlin
| 00:00 | 02:00 | 04:00 | 06:00 | 08:00 | 10:00 | 12:00 | 14:00 | 16:00 | 18:00 | 20:00 | 22:00 | |
|---|---|---|---|---|---|---|---|---|---|---|---|---|
| 25.07.2026 | 0,570 | 0,511 | 0,507 | 0,506 | - | - | - | - | - | - | - | - |
| 24.07.2026 | 0,645 | 0,620 | 0,000 | 0,435 | 0,521 | 0,404 | 0,380 | 0,362 | 0,529 | 0,547 | 0,489 | 0,545 |
| 23.07.2026 | 0,516 | 0,499 | 0,000 | 0,372 | 0,372 | 0,335 | 0,341 | 0,352 | 1,68 | 0,970 | 0,881 | 0,689 |
| 22.07.2026 | - | 0,552 | 0,136 | 0,317 | 0,305 | 0,341 | 0,342 | 0,347 | 0,544 | 0,456 | 0,526 | 0,505 |
| 21.07.2026 | 0,456 | 0,462 | 0,091 | 0,288 | 0,313 | 0,354 | 0,351 | 0,313 | 0,530 | 0,470 | 0,458 | 0,488 |
| 20.07.2026 | 0,461 | 0,445 | 0,070 | 0,251 | 0,349 | 0,342 | 0,325 | 0,331 | 0,506 | 0,479 | 0,482 | 0,471 |
| 19.07.2026 | 0,467 | 0,468 | 0,469 | 0,462 | 0,473 | 0,470 | 0,476 | 0,480 | 0,476 | 0,485 | 0,630 | 0,462 |
| 18.07.2026 | 0,781 | 0,937 | 0,610 | 0,491 | 0,479 | 0,488 | 0,513 | 0,522 | 0,477 | 0,498 | 0,489 | 0,482 |
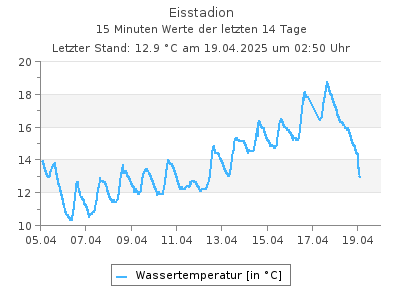
Aktuelle Wassertemperaturen als Tabelle
Letzter Tagesmittelwert (24.07.2026): 18,6 °CWassertemperaturen in °C im Intervall von 2 Stunden (in MEZ), Quelle: Land Berlin
| 00:00 | 02:00 | 04:00 | 06:00 | 08:00 | 10:00 | 12:00 | 14:00 | 16:00 | 18:00 | 20:00 | 22:00 | |
|---|---|---|---|---|---|---|---|---|---|---|---|---|
| 25.07.2026 | 19,0 | 18,7 | 18,4 | 18,1 | - | - | - | - | - | - | - | - |
| 24.07.2026 | 18,5 | 18,1 | 17,6 | 17,6 | 17,6 | 17,8 | 18,4 | 19,2 | 20,1 | 19,6 | 19,3 | 19,1 |
| 23.07.2026 | 18,2 | 18,1 | 17,9 | 17,8 | 17,9 | 18,0 | 18,5 | 18,8 | 19,2 | 18,4 | 18,1 | 18,4 |
| 22.07.2026 | 18,7 | 18,5 | 18,0 | 18,0 | 17,9 | 18,0 | 18,3 | 18,4 | 18,7 | 18,7 | 18,6 | 18,4 |
| 21.07.2026 | 18,6 | 18,3 | 18,0 | 18,0 | 18,0 | 18,3 | 18,8 | 19,3 | 19,5 | 19,3 | 19,0 | 18,9 |
| 20.07.2026 | 18,8 | 18,6 | 18,4 | 18,4 | 18,4 | 18,4 | 18,6 | 19,0 | 19,4 | 19,3 | 19,0 | 18,8 |
| 19.07.2026 | 20,5 | 20,3 | 19,9 | 19,7 | 19,5 | 19,6 | 20,2 | 20,3 | 20,3 | 19,8 | 19,6 | 19,3 |
| 18.07.2026 | 21,0 | 21,1 | 20,6 | 20,4 | 20,6 | 21,0 | 21,3 | 22,1 | 22,6 | 21,8 | 21,3 | 20,8 |
| Messstellennummer | 5867601 |
|---|---|
| Messstellenname | Eisstadion |
| Gewässer | Panke |
| Betreiber | Land Berlin |
| Messstellenausprägung | Wasserstand und Durchfluss |
| Flusskilometer | |
| Pegelnullpunkt (m +NHN) | 31.85 |
| Rechtswert (UTM 33 N) | 389447.20 |
| Hochwert (UTM 33 N) | 5822141.23 |
Für diese Station sind keine Hauptwerte vorhanden
Als Favorit speichern Als Favorit entfernen
Durch die Liste der Durchfluss-Messstellen blättern: