 DGS
DGS Leichte Sprache
MPS Landwehrkanal
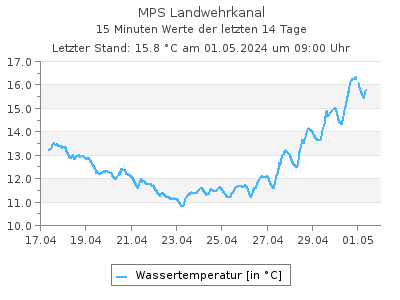
Aktuelle Wassertemperaturen als Tabelle
Letzter Tagesmittelwert (26.05.2026): 21,4 °CWassertemperaturen in °C im Intervall von 2 Stunden (in MEZ), Quelle: Land Berlin
| 00:00 | 02:00 | 04:00 | 06:00 | 08:00 | 10:00 | 12:00 | 14:00 | 16:00 | 18:00 | 20:00 | 22:00 | |
|---|---|---|---|---|---|---|---|---|---|---|---|---|
| 12.06.2026 | 20,8 | 20,7 | 20,5 | 20,3 | 20,1 | - | - | - | - | - | - | - |
| 11.06.2026 | 20,8 | 20,6 | 20,4 | 20,1 | 20,1 | 20,3 | - | 20,6 | 20,8 | 20,8 | 20,8 | 20,7 |
| 10.06.2026 | 21,2 | 21,0 | 20,9 | 20,7 | 20,6 | 20,8 | 20,7 | 20,8 | 20,9 | 21,0 | 21,0 | 20,9 |
| 09.06.2026 | 22,1 | 21,9 | 21,7 | 21,5 | 21,2 | 21,1 | 21,2 | 21,3 | 21,5 | 21,4 | 21,4 | 21,3 |
| 08.06.2026 | 21,4 | 21,2 | 21,0 | 20,9 | 20,9 | 21,0 | 21,1 | 21,6 | 21,8 | 21,9 | 21,9 | 22,1 |
| 07.06.2026 | 21,7 | 21,5 | 21,3 | 21,2 | 21,1 | 21,1 | 21,3 | 21,4 | 21,5 | 21,5 | 21,5 | 21,5 |
| 06.06.2026 | 21,2 | 21,0 | 21,0 | 20,8 | 20,7 | 20,9 | 21,2 | 21,3 | 21,6 | 21,9 | 22,1 | 22,0 |
| 05.06.2026 | 21,4 | 21,3 | 21,2 | 21,0 | 20,9 | 21,0 | 21,0 | 21,1 | 21,3 | 21,3 | 21,3 | 21,2 |
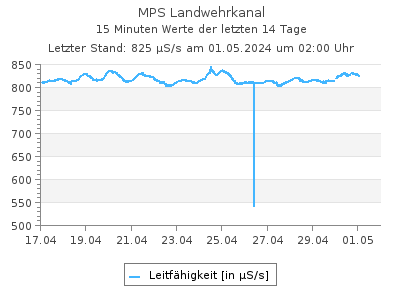
Aktuelle Leitfähigkeit als Tabelle
Letzter Tagesmittelwert (26.05.2026): 873 µS/sLeitfähigkeit in µS/s im Intervall von 2 Stunden (in MEZ), Quelle: Land Berlin
| 00:00 | 02:00 | 04:00 | 06:00 | 08:00 | 10:00 | 12:00 | 14:00 | 16:00 | 18:00 | 20:00 | 22:00 | |
|---|---|---|---|---|---|---|---|---|---|---|---|---|
| 12.06.2026 | 903 | 899 | 895 | 892 | 889 | - | - | - | - | - | - | - |
| 11.06.2026 | 916 | 913 | 908 | 906 | 906 | 906 | - | 901 | 902 | 907 | 909 | 905 |
| 10.06.2026 | 937 | 936 | 933 | 932 | 930 | 929 | 929 | 928 | 926 | 928 | 923 | 919 |
| 09.06.2026 | 933 | 931 | 929 | 929 | 927 | 926 | 926 | 927 | 930 | 935 | 935 | 937 |
| 08.06.2026 | 928 | 929 | 928 | 928 | 931 | 931 | 932 | 934 | 933 | 935 | 936 | 935 |
| 07.06.2026 | 924 | 925 | 924 | 924 | 923 | 922 | 922 | 921 | 922 | 923 | 927 | 927 |
| 06.06.2026 | 906 | 907 | 907 | 907 | 908 | 909 | 911 | 912 | 914 | 918 | 921 | 922 |
| 05.06.2026 | 897 | 897 | 894 | 893 | 893 | 893 | 893 | 894 | 895 | 897 | 902 | 905 |
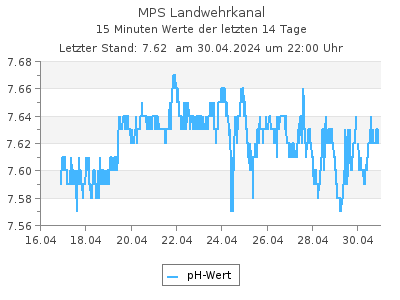
Aktuelle pH-Werte als Tabelle
Letzter Tagesmittelwert (26.05.2026): 7,44pH-Werte im Intervall von 2 Stunden (in MEZ), Quelle: Land Berlin
| 00:00 | 02:00 | 04:00 | 06:00 | 08:00 | 10:00 | 12:00 | 14:00 | 16:00 | 18:00 | 20:00 | 22:00 | |
|---|---|---|---|---|---|---|---|---|---|---|---|---|
| 12.06.2026 | 7,57 | 7,55 | 7,54 | 7,52 | 7,51 | - | - | - | - | - | - | - |
| 11.06.2026 | 7,56 | 7,55 | 7,52 | 7,50 | 7,53 | 7,53 | - | 7,53 | 7,53 | 7,55 | 7,56 | 7,58 |
| 10.06.2026 | 7,55 | 7,55 | 7,54 | 7,53 | 7,51 | 7,52 | 7,52 | 7,52 | 7,55 | 7,56 | 7,57 | 7,57 |
| 09.06.2026 | 7,53 | 7,51 | 7,48 | 7,47 | 7,49 | 7,47 | 7,50 | 7,50 | 7,53 | 7,54 | 7,52 | 7,55 |
| 08.06.2026 | 7,50 | 7,48 | 7,48 | 7,47 | 7,48 | 7,46 | 7,49 | 7,50 | 7,51 | 7,52 | 7,52 | 7,52 |
| 07.06.2026 | 7,46 | 7,47 | 7,46 | 7,45 | 7,45 | 7,46 | 7,47 | 7,47 | 7,48 | 7,48 | 7,48 | 7,50 |
| 06.06.2026 | 7,46 | 7,46 | 7,46 | 7,44 | 7,46 | 7,46 | 7,47 | 7,47 | 7,48 | 7,48 | 7,49 | 7,47 |
| 05.06.2026 | 7,44 | 7,45 | 7,44 | 7,43 | 7,43 | 7,43 | 7,45 | 7,44 | 7,44 | 7,45 | 7,45 | 7,47 |
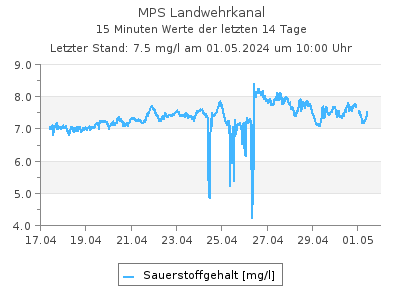
Aktuelle Sauerstoffgehalt-Werte als Tabelle
Letzter Tagesmittelwert (26.05.2026): 5,78 mg/lSauerstoffgehalt-Werte in mg/l im Intervall von 2 Stunden (in MEZ), Quelle: Land Berlin
| 00:00 | 02:00 | 04:00 | 06:00 | 08:00 | 10:00 | 12:00 | 14:00 | 16:00 | 18:00 | 20:00 | 22:00 | |
|---|---|---|---|---|---|---|---|---|---|---|---|---|
| 12.06.2026 | 5,25 | 4,91 | 4,81 | 4,52 | 4,56 | - | - | - | - | - | - | - |
| 11.06.2026 | 5,15 | 4,97 | 4,69 | 4,74 | 4,84 | 4,72 | - | 4,71 | 5,00 | 5,16 | 5,29 | 5,35 |
| 10.06.2026 | 4,82 | 4,87 | 4,72 | 4,50 | 4,30 | 4,54 | 4,40 | 4,64 | 4,94 | 5,12 | 5,20 | 5,18 |
| 09.06.2026 | 4,50 | 4,25 | 4,08 | 3,82 | 4,13 | 3,95 | 4,03 | 4,34 | 4,61 | 4,83 | 4,65 | 4,92 |
| 08.06.2026 | 4,13 | 3,90 | 3,81 | 3,69 | 3,86 | 3,65 | 3,93 | 4,33 | 4,36 | 4,56 | 4,56 | 4,70 |
| 07.06.2026 | 3,75 | 3,90 | 3,61 | 3,29 | 3,39 | 3,60 | 3,78 | 3,80 | 3,88 | 3,99 | 3,99 | 4,20 |
| 06.06.2026 | 3,91 | 3,63 | 3,75 | 3,36 | 3,63 | 3,67 | 3,72 | 3,68 | 4,02 | 4,12 | 4,28 | 3,94 |
| 05.06.2026 | 3,80 | 3,83 | 3,58 | 3,43 | 3,37 | 3,50 | 3,53 | 3,25 | 3,29 | 3,44 | 3,66 | 3,95 |
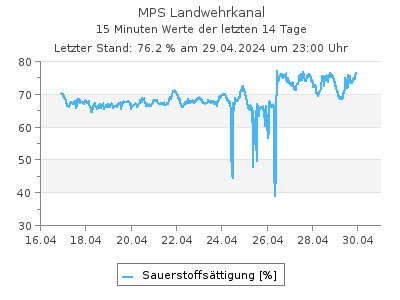
Aktuelle Werte Sauerstoffsättigung als Tabelle
Letzter Tagesmittelwert (10.06.2026): 53,8 %Werte Sauerstoffsättigung in % im Intervall von 2 Stunden (in MEZ), Quelle: Land Berlin
| 00:00 | 02:00 | 04:00 | 06:00 | 08:00 | 10:00 | 12:00 | 14:00 | 16:00 | 18:00 | 20:00 | 22:00 | |
|---|---|---|---|---|---|---|---|---|---|---|---|---|
| 12.06.2026 | 58,7 | - | - | - | - | - | - | - | - | - | - | - |
| 11.06.2026 | 57,6 | 55,4 | 52,1 | 52,4 | 53,5 | 52,3 | - | 52,5 | 56,0 | 57,7 | 59,2 | 59,8 |
| 10.06.2026 | 54,3 | 54,8 | 52,9 | 50,2 | 47,9 | 50,8 | 49,1 | 51,9 | 55,4 | 57,5 | 58,4 | 58,1 |
| 09.06.2026 | 51,6 | 48,6 | 46,4 | 43,3 | 46,6 | 44,5 | 45,5 | 49,0 | 52,3 | 54,7 | 52,7 | 55,6 |
| 08.06.2026 | 46,7 | 44,0 | 42,8 | 41,3 | 43,3 | 41,0 | 44,2 | 49,3 | 49,7 | 52,1 | 52,2 | 53,9 |
| 07.06.2026 | 42,7 | 44,3 | 40,8 | 37,1 | 38,1 | 40,5 | 42,7 | 43,0 | 44,0 | 45,3 | 45,3 | 47,6 |
| 06.06.2026 | 44,1 | 40,8 | 42,1 | 37,6 | 40,5 | 41,2 | 41,9 | 41,6 | 45,7 | 47,1 | 49,1 | 45,1 |
| 05.06.2026 | 43,0 | 43,3 | 40,4 | 38,5 | 37,8 | 39,3 | 39,7 | 36,6 | 37,2 | 38,9 | 41,3 | 44,6 |
| Messstellennummer | 509 |
|---|---|
| Messstellenname | MPS Landwehrkanal |
| Gewässer | Landwehrkanal |
| Betreiber | Land Berlin |
| Messstellenausprägung | Online-Messstelle |
| Flusskilometer | 5.47 |
| Rechtswert (UTM 33 N) | 390252.94 |
| Hochwert (UTM 33 N) | 5817774.13 |
Als Favorit speichern Als Favorit entfernen
Durch die Liste der Durchfluss-Messstellen blättern: