 DGS
DGS Leichte Sprache
MS Schmöckwitz
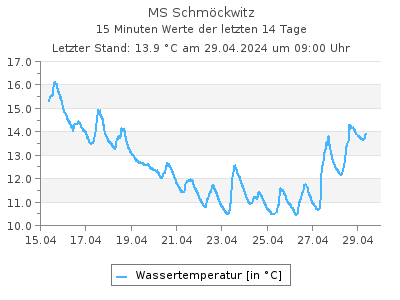
Aktuelle Wassertemperaturen als Tabelle
Letzter Tagesmittelwert (05.07.2026): 22,3 °CWassertemperaturen in °C im Intervall von 2 Stunden (in MEZ), Quelle: Land Berlin
| 00:00 | 02:00 | 04:00 | 06:00 | 08:00 | 10:00 | 12:00 | 14:00 | 16:00 | 18:00 | 20:00 | 22:00 | |
|---|---|---|---|---|---|---|---|---|---|---|---|---|
| 02.08.2026 | 22,9 | 22,7 | 22,7 | 22,6 | 22,6 | 23,0 | 23,6 | - | - | - | - | - |
| 01.08.2026 | 24,5 | 24,5 | 24,3 | 24,4 | 24,2 | 23,9 | 23,9 | 23,7 | 23,5 | 23,4 | 23,3 | 23,1 |
| 31.07.2026 | 25,4 | 24,3 | 24,8 | 24,2 | 23,9 | 24,4 | 24,4 | 24,6 | 24,7 | 24,6 | 24,4 | 24,5 |
| 30.07.2026 | 23,1 | 22,9 | 22,7 | 22,6 | 22,7 | 22,7 | 23,2 | 24,4 | 25,8 | 26,1 | 26,0 | 25,8 |
| 29.07.2026 | 22,0 | 21,7 | 21,6 | 21,5 | 21,6 | 21,8 | 22,0 | 22,2 | 22,6 | 22,9 | 23,3 | 23,2 |
| 28.07.2026 | 21,6 | 21,4 | 21,2 | 21,0 | 21,0 | 21,4 | 21,7 | 22,2 | 22,4 | 22,4 | 22,4 | 22,2 |
| 27.07.2026 | 22,3 | 22,1 | 21,9 | 21,6 | 21,7 | 21,9 | 22,1 | 22,4 | 22,3 | 22,2 | 22,1 | 21,9 |
| 26.07.2026 | 22,8 | 22,6 | 22,4 | 22,3 | 22,2 | 22,3 | 22,5 | 23,0 | 23,0 | 22,8 | 22,7 | 22,6 |
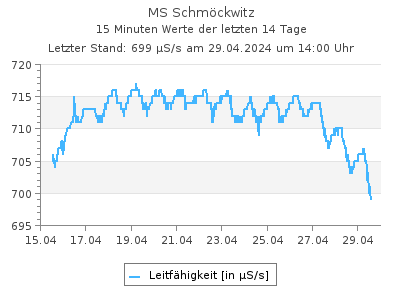
Aktuelle Leitfähigkeit als Tabelle
Letzter Tagesmittelwert (06.07.2026): 811 µS/sLeitfähigkeit in µS/s im Intervall von 2 Stunden (in MEZ), Quelle: Land Berlin
| 00:00 | 02:00 | 04:00 | 06:00 | 08:00 | 10:00 | 12:00 | 14:00 | 16:00 | 18:00 | 20:00 | 22:00 | |
|---|---|---|---|---|---|---|---|---|---|---|---|---|
| 02.08.2026 | 728 | 726 | 721 | 720 | 719 | 719 | 713 | - | - | - | - | - |
| 01.08.2026 | 724 | 720 | 722 | 712 | 711 | 733 | 725 | 732 | 735 | 731 | 732 | 727 |
| 31.07.2026 | 697 | 759 | 713 | 742 | 751 | 726 | 730 | 728 | 730 | 740 | 747 | 743 |
| 30.07.2026 | 736 | 736 | 737 | 737 | 732 | 736 | 737 | 728 | 717 | 704 | 697 | 691 |
| 29.07.2026 | 755 | 759 | 761 | 761 | 754 | 755 | 756 | 747 | 746 | 739 | 734 | 736 |
| 28.07.2026 | 768 | 774 | 777 | 777 | 768 | 764 | 758 | 751 | 748 | 757 | 755 | 748 |
| 27.07.2026 | 756 | 761 | 763 | 763 | 764 | 765 | 760 | 758 | 757 | 755 | 760 | 763 |
| 26.07.2026 | 747 | 747 | 751 | 752 | 747 | 751 | 759 | 742 | 750 | 755 | 760 | 760 |
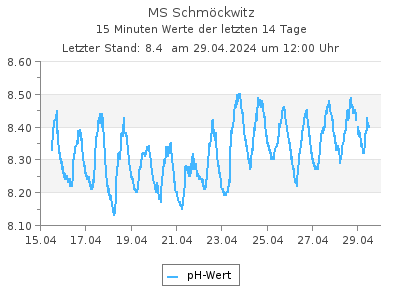
Aktuelle pH-Werte als Tabelle
Letzter Tagesmittelwert (05.07.2026): 8,07pH-Werte im Intervall von 2 Stunden (in MEZ), Quelle: Land Berlin
| 00:00 | 02:00 | 04:00 | 06:00 | 08:00 | 10:00 | 12:00 | 14:00 | 16:00 | 18:00 | 20:00 | 22:00 | |
|---|---|---|---|---|---|---|---|---|---|---|---|---|
| 02.08.2026 | 7,83 | 7,84 | 7,94 | 7,93 | 8,00 | 8,22 | 8,41 | - | - | - | - | - |
| 01.08.2026 | 8,45 | 8,42 | 8,34 | 8,44 | 8,38 | 8,22 | 8,23 | 8,16 | 8,10 | 8,07 | 7,92 | 7,93 |
| 31.07.2026 | 8,63 | 8,38 | 8,44 | 8,23 | 8,21 | 8,55 | 8,48 | 8,55 | 8,57 | 8,52 | 8,34 | 8,31 |
| 30.07.2026 | 8,81 | 8,78 | 8,72 | 8,67 | 8,79 | 8,69 | 8,71 | 8,89 | 8,99 | 8,90 | 8,80 | 8,73 |
| 29.07.2026 | 8,66 | 8,59 | 8,51 | 8,47 | 8,58 | 8,62 | 8,63 | 8,73 | 8,76 | 8,82 | 8,90 | 8,84 |
| 28.07.2026 | 8,51 | 8,45 | 8,35 | 8,28 | 8,40 | 8,54 | 8,60 | 8,70 | 8,76 | 8,72 | 8,73 | 8,77 |
| 27.07.2026 | 8,61 | 8,49 | 8,43 | 8,44 | 8,48 | 8,59 | 8,67 | 8,70 | 8,71 | 8,72 | 8,64 | 8,57 |
| 26.07.2026 | 8,84 | 8,82 | 8,75 | 8,69 | 8,78 | 8,75 | 8,74 | 8,90 | 8,83 | 8,82 | 8,74 | 8,68 |
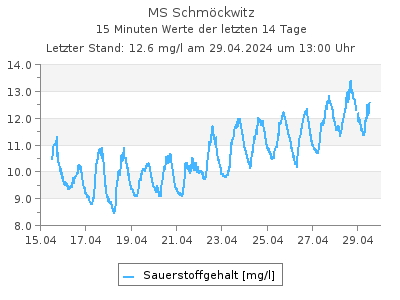
Aktuelle Sauerstoffgehalt-Werte als Tabelle
Letzter Tagesmittelwert (05.07.2026): 7,81 mg/lSauerstoffgehalt-Werte in mg/l im Intervall von 2 Stunden (in MEZ), Quelle: Land Berlin
| 00:00 | 02:00 | 04:00 | 06:00 | 08:00 | 10:00 | 12:00 | 14:00 | 16:00 | 18:00 | 20:00 | 22:00 | |
|---|---|---|---|---|---|---|---|---|---|---|---|---|
| 02.08.2026 | 5,68 | 5,66 | 6,27 | 6,14 | 6,57 | 7,89 | 9,06 | - | - | - | - | - |
| 01.08.2026 | 11,9 | 12,0 | 10,9 | 11,6 | 10,9 | 9,53 | 9,44 | 8,88 | 8,30 | 7,83 | 6,44 | 6,49 |
| 31.07.2026 | 15,8 | 12,7 | 13,1 | 10,8 | 9,98 | 13,5 | 13,1 | 13,9 | 13,8 | 13,7 | 11,8 | 11,5 |
| 30.07.2026 | 12,9 | 12,2 | 11,1 | 10,4 | 12,2 | 12,4 | 13,6 | 16,1 | 17,3 | 18,2 | 18,1 | 17,1 |
| 29.07.2026 | 10,8 | 10,1 | 9,49 | 8,93 | 10,2 | 10,7 | 11,1 | 12,5 | 12,7 | 13,1 | 14,4 | 13,5 |
| 28.07.2026 | 10,0 | 9,57 | 8,73 | 8,06 | 8,85 | 10,2 | 10,6 | 11,5 | 12,1 | 12,0 | 11,9 | 12,1 |
| 27.07.2026 | 11,5 | 10,3 | 9,74 | 9,73 | 10,0 | 11,3 | 11,8 | 12,3 | 12,3 | 12,1 | 11,2 | 10,5 |
| 26.07.2026 | 13,8 | 13,5 | 12,8 | 12,0 | 13,3 | 13,1 | 13,4 | 16,0 | 14,6 | 14,5 | 13,7 | 12,8 |
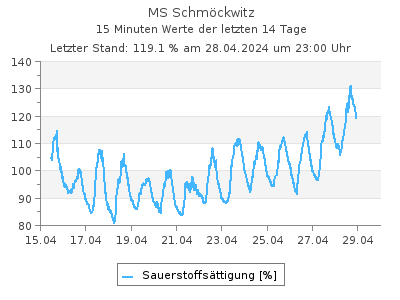
Aktuelle Werte Sauerstoffsättigung als Tabelle
Letzter Tagesmittelwert (01.08.2026): 110 %Werte Sauerstoffsättigung in % im Intervall von 2 Stunden (in MEZ), Quelle: Land Berlin
| 00:00 | 02:00 | 04:00 | 06:00 | 08:00 | 10:00 | 12:00 | 14:00 | 16:00 | 18:00 | 20:00 | 22:00 | |
|---|---|---|---|---|---|---|---|---|---|---|---|---|
| 02.08.2026 | 66,1 | - | - | - | - | - | - | - | - | - | - | - |
| 01.08.2026 | 143 | 144 | 130 | 138 | 130 | 113 | 112 | 105 | 97,8 | 92,1 | 75,5 | 75,8 |
| 31.07.2026 | 192 | 151 | 158 | 129 | 118 | 162 | 157 | 167 | 166 | 165 | 142 | 138 |
| 30.07.2026 | 150 | 142 | 129 | 121 | 142 | 143 | 160 | 193 | 212 | 225 | 223 | 211 |
| 29.07.2026 | 124 | 115 | 108 | 101 | 116 | 122 | 127 | 144 | 147 | 153 | 168 | 158 |
| 28.07.2026 | 114 | 108 | 98,4 | 90,6 | 99,5 | 115 | 120 | 132 | 139 | 138 | 137 | 139 |
| 27.07.2026 | 132 | 118 | 111 | 111 | 114 | 129 | 135 | 142 | 142 | 139 | 129 | 120 |
| 26.07.2026 | 161 | 157 | 147 | 138 | 152 | 151 | 154 | 187 | 171 | 168 | 159 | 148 |
| Messstellennummer | 211 |
|---|---|
| Messstellenname | MS Schmöckwitz |
| Gewässer | Dahme |
| Betreiber | Land Berlin |
| Messstellenausprägung | Messstation |
| Flusskilometer | 0.29 |
| Rechtswert (UTM 33 N) | 408335.31 |
| Hochwert (UTM 33 N) | 5803523.72 |
Als Favorit speichern Als Favorit entfernen
Durch die Liste der Durchfluss-Messstellen blättern: