 DGS
DGS Leichte Sprache
MPS Fischerinsel
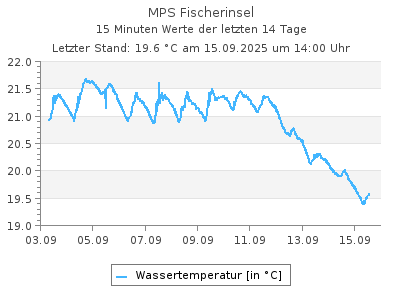
Aktuelle Wassertemperaturen als Tabelle
Letzter Tagesmittelwert (28.06.2026): 27,5 °CWassertemperaturen in °C im Intervall von 2 Stunden (in MEZ), Quelle: Land Berlin
| 00:00 | 02:00 | 04:00 | 06:00 | 08:00 | 10:00 | 12:00 | 14:00 | 16:00 | 18:00 | 20:00 | 22:00 | |
|---|---|---|---|---|---|---|---|---|---|---|---|---|
| 09.07.2026 | 20,7 | 20,6 | 20,5 | 20,3 | 20,3 | 20,2 | 20,7 | 20,7 | 21,0 | - | - | - |
| 08.07.2026 | 20,9 | 20,8 | 20,6 | 20,4 | 20,4 | 20,4 | 20,7 | 20,8 | 20,9 | 20,9 | 20,9 | 20,8 |
| 07.07.2026 | 21,3 | 21,2 | 21,2 | 21,1 | 21,1 | 21,1 | 21,2 | 21,2 | 21,3 | 21,2 | 21,1 | 21,0 |
| 06.07.2026 | 22,2 | 22,0 | 21,8 | 21,7 | 21,6 | 21,7 | 21,6 | 21,6 | 21,6 | 21,5 | 21,5 | 21,4 |
| 05.07.2026 | 22,8 | 22,6 | 22,5 | 22,4 | 22,3 | 22,3 | 22,4 | 22,5 | 22,6 | 22,6 | 22,5 | 22,3 |
| 04.07.2026 | 24,2 | 23,9 | 23,7 | 23,5 | 23,4 | 23,4 | 23,4 | 23,4 | 23,3 | 23,2 | 23,0 | 22,9 |
| 03.07.2026 | 25,8 | 25,6 | 25,4 | 25,2 | 25,1 | 24,9 | 24,9 | 25,0 | 24,9 | 24,8 | 24,6 | 24,3 |
| 02.07.2026 | 26,3 | 26,1 | 25,9 | 25,9 | 25,9 | 26,1 | 26,1 | 26,3 | 26,3 | 26,2 | 26,1 | 25,9 |
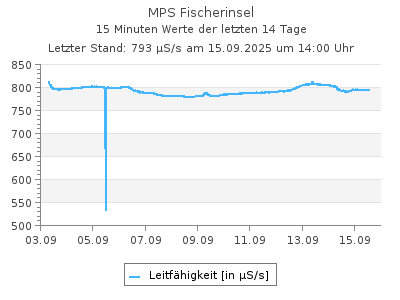
Aktuelle Leitfähigkeit als Tabelle
Letzter Tagesmittelwert (26.05.2026): 847 µS/sLeitfähigkeit in µS/s im Intervall von 2 Stunden (in MEZ), Quelle: Land Berlin
| 00:00 | 02:00 | 04:00 | 06:00 | 08:00 | 10:00 | 12:00 | 14:00 | 16:00 | 18:00 | 20:00 | 22:00 | |
|---|---|---|---|---|---|---|---|---|---|---|---|---|
| 09.07.2026 | 889 | 891 | 890 | 890 | 890 | 891 | 891 | 892 | 894 | - | - | - |
| 08.07.2026 | 879 | 880 | 880 | 880 | 884 | 885 | 885 | 885 | 886 | 888 | 888 | 889 |
| 07.07.2026 | 875 | 874 | 875 | 875 | 874 | 875 | 875 | 876 | 878 | 878 | 878 | 879 |
| 06.07.2026 | 868 | 868 | 867 | 869 | 868 | 869 | 868 | 869 | 870 | 871 | 872 | 873 |
| 05.07.2026 | 862 | 861 | 863 | 862 | 863 | 863 | 862 | 864 | 864 | 865 | 866 | 868 |
| 04.07.2026 | 860 | 859 | 860 | 858 | 859 | 859 | 859 | 858 | 859 | 860 | 861 | 860 |
| 03.07.2026 | 862 | 860 | 860 | 860 | 859 | 860 | 860 | 860 | 860 | 860 | 860 | 859 |
| 02.07.2026 | 861 | 861 | 859 | 859 | 859 | 860 | 861 | 861 | 861 | 861 | 861 | 861 |
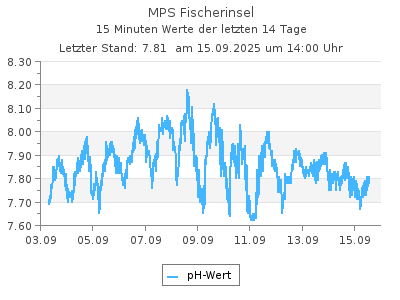
Aktuelle pH-Werte als Tabelle
Letzter Tagesmittelwert (26.05.2026): 7,29pH-Werte im Intervall von 2 Stunden (in MEZ), Quelle: Land Berlin
| 00:00 | 02:00 | 04:00 | 06:00 | 08:00 | 10:00 | 12:00 | 14:00 | 16:00 | 18:00 | 20:00 | 22:00 | |
|---|---|---|---|---|---|---|---|---|---|---|---|---|
| 09.07.2026 | 7,65 | 7,63 | 7,61 | 7,59 | 7,66 | 7,68 | 7,69 | 7,72 | 7,73 | - | - | - |
| 08.07.2026 | 7,60 | 7,60 | 7,57 | 7,62 | 7,68 | 7,65 | 7,67 | 7,66 | 7,65 | 7,68 | 7,69 | 7,70 |
| 07.07.2026 | 7,56 | 7,54 | 7,53 | 7,53 | 7,58 | 7,61 | 7,61 | 7,60 | 7,60 | 7,59 | 7,59 | 7,61 |
| 06.07.2026 | 7,53 | 7,50 | 7,51 | 7,51 | 7,59 | 7,61 | 7,58 | 7,61 | 7,60 | 7,60 | 7,57 | 7,56 |
| 05.07.2026 | 7,47 | 7,47 | 7,45 | 7,47 | 7,51 | 7,51 | 7,55 | 7,56 | 7,58 | 7,57 | 7,54 | 7,54 |
| 04.07.2026 | 7,48 | 7,45 | 7,46 | 7,45 | 7,51 | 7,51 | 7,52 | 7,53 | 7,51 | 7,50 | 7,51 | 7,50 |
| 03.07.2026 | 7,43 | 7,43 | 7,42 | 7,46 | 7,48 | 7,47 | 7,46 | 7,49 | 7,51 | 7,49 | 7,46 | 7,53 |
| 02.07.2026 | 7,40 | 7,39 | 7,39 | 7,40 | 7,44 | 7,44 | 7,50 | 7,45 | 7,45 | 7,47 | 7,44 | 7,44 |
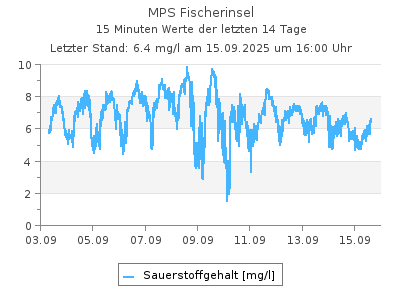
Aktuelle Sauerstoffgehalt-Werte als Tabelle
Letzter Tagesmittelwert (26.05.2026): 4,32 mg/lSauerstoffgehalt-Werte in mg/l im Intervall von 2 Stunden (in MEZ), Quelle: Land Berlin
| 00:00 | 02:00 | 04:00 | 06:00 | 08:00 | 10:00 | 12:00 | 14:00 | 16:00 | 18:00 | 20:00 | 22:00 | |
|---|---|---|---|---|---|---|---|---|---|---|---|---|
| 09.07.2026 | 6,10 | 6,18 | 5,14 | 6,40 | 6,28 | 6,56 | 7,20 | 7,07 | 7,42 | - | - | - |
| 08.07.2026 | 5,77 | 4,83 | 4,13 | 6,11 | 6,74 | 6,47 | 6,80 | 6,38 | 6,51 | 6,73 | 6,60 | 6,73 |
| 07.07.2026 | 3,32 | 3,26 | 2,89 | 4,06 | 5,53 | 5,68 | 5,92 | 5,79 | 5,72 | 5,97 | 5,88 | 5,31 |
| 06.07.2026 | 3,34 | 3,69 | 3,45 | 3,00 | 4,47 | 5,50 | 5,28 | 5,85 | 5,76 | 5,70 | 4,54 | 3,21 |
| 05.07.2026 | 2,60 | 3,25 | 2,07 | 3,11 | 3,39 | 4,02 | 4,58 | 4,79 | 5,37 | 5,33 | 4,13 | 4,32 |
| 04.07.2026 | 2,76 | 1,94 | 1,98 | 2,83 | 3,74 | 3,41 | 4,35 | 4,38 | 4,24 | 4,06 | 4,13 | 3,43 |
| 03.07.2026 | 2,71 | 2,58 | 1,81 | 3,10 | 3,33 | 3,58 | 3,61 | 3,84 | 4,93 | 4,11 | 3,37 | 4,79 |
| 02.07.2026 | 2,04 | 1,31 | 1,47 | 0,970 | 2,58 | 3,05 | 3,97 | 3,13 | 3,77 | 4,02 | 3,14 | 3,04 |
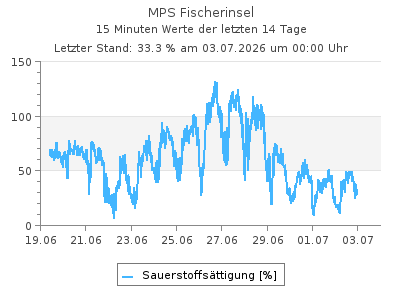
Aktuelle Werte Sauerstoffsättigung als Tabelle
Letzter Tagesmittelwert (08.07.2026): 69,7 %Werte Sauerstoffsättigung in % im Intervall von 2 Stunden (in MEZ), Quelle: Land Berlin
| 00:00 | 02:00 | 04:00 | 06:00 | 08:00 | 10:00 | 12:00 | 14:00 | 16:00 | 18:00 | 20:00 | 22:00 | |
|---|---|---|---|---|---|---|---|---|---|---|---|---|
| 09.07.2026 | 68,2 | - | - | - | - | - | - | - | - | - | - | - |
| 08.07.2026 | 64,7 | 54,0 | 46,0 | 67,8 | 74,8 | 71,8 | 75,9 | 71,4 | 73,0 | 75,5 | 74,0 | 75,3 |
| 07.07.2026 | 37,5 | 36,8 | 32,6 | 45,7 | 62,2 | 63,9 | 66,7 | 65,4 | 64,6 | 67,3 | 66,2 | 59,7 |
| 06.07.2026 | 38,4 | 42,3 | 39,4 | 34,1 | 50,8 | 62,6 | 60,0 | 66,5 | 65,4 | 64,7 | 51,5 | 36,4 |
| 05.07.2026 | 30,2 | 37,7 | 23,9 | 35,9 | 39,1 | 46,3 | 52,9 | 55,4 | 62,2 | 61,7 | 47,7 | 49,8 |
| 04.07.2026 | 32,9 | 23,0 | 23,4 | 33,3 | 44,0 | 40,1 | 51,1 | 51,5 | 49,8 | 47,6 | 48,2 | 40,0 |
| 03.07.2026 | 33,3 | 31,6 | 22,1 | 37,7 | 40,4 | 43,3 | 43,7 | 46,5 | 59,6 | 49,6 | 40,6 | 57,3 |
| 02.07.2026 | 25,3 | 16,2 | 18,1 | 11,9 | 31,7 | 37,7 | 49,1 | 38,8 | 46,8 | 49,8 | 38,8 | 37,5 |
| Messstellennummer | 139 |
|---|---|
| Messstellenname | MPS Fischerinsel |
| Gewässer | Spree |
| Betreiber | Land Berlin |
| Messstellenausprägung | Online-Messstelle |
| Flusskilometer | |
| Rechtswert (UTM 33 N) | 392155.67 |
| Hochwert (UTM 33 N) | 5819388.97 |
Als Favorit speichern Als Favorit entfernen
Durch die Liste der Durchfluss-Messstellen blättern: