 DGS
DGS Leichte Sprache
Eisstadion
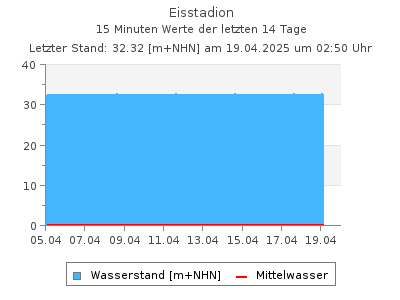
Aktuelle Wasserstõnde als Tabelle
Letzter Tagesmittelwert (18.02.2026): 49,2 cmWasserstõnde W in cm im Intervall von 2 Stunden (in MEZ), Quelle: Land Berlin
| 00:00 | 02:00 | 04:00 | 06:00 | 08:00 | 10:00 | 12:00 | 14:00 | 16:00 | 18:00 | 20:00 | 22:00 | |
|---|---|---|---|---|---|---|---|---|---|---|---|---|
| 18.02.2026 | 49,2 | 49,5 | 49,5 | 49,7 | 49,7 | 49,2 | 48,8 | 48,8 | 48,7 | - | - | - |
| 17.02.2026 | 49,9 | 50,1 | 50,0 | 50,1 | 49,6 | 49,3 | 48,9 | 48,4 | 48,4 | 48,6 | 48,9 | 49,2 |
| 16.02.2026 | 50,4 | 50,5 | 50,4 | 50,3 | 51,8 | 50,2 | 49,8 | 49,5 | 49,3 | 49,4 | 49,6 | 49,8 |
| 15.02.2026 | 52,0 | 51,8 | 51,8 | 51,9 | 51,7 | 51,5 | 51,0 | 50,1 | 49,6 | 49,5 | 50,0 | 50,3 |
| 14.02.2026 | 54,7 | 54,2 | 53,9 | 53,6 | 53,2 | 53,0 | 52,7 | 52,5 | 52,2 | 51,9 | 51,7 | 51,9 |
| 13.02.2026 | 59,6 | 55,5 | 55,4 | 56,1 | 56,2 | 56,0 | 55,1 | 55,1 | 54,8 | 55,2 | 55,4 | 54,9 |
| 12.02.2026 | 49,1 | 49,5 | 50,4 | 50,4 | 50,2 | 50,2 | 49,8 | 49,7 | 50,3 | 58,9 | 68,8 | 65,8 |
| 11.02.2026 | 46,1 | 46,4 | 46,9 | 47,2 | 47,1 | 46,9 | 46,9 | 47,8 | 47,6 | 47,8 | 49,0 | 49,4 |
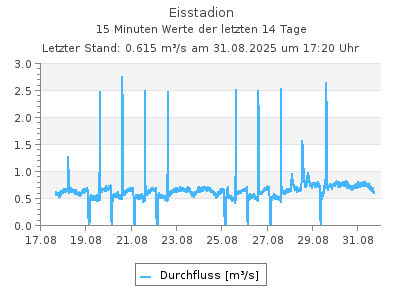
Aktuelle Abfl³sse als Tabelle
Letzter Tagesmittelwert (18.02.2026): 1,58 m3/sAbfl³sse Q in m│/s im Intervall von 2 Stunden (in MEZ), Quelle: Land Berlin
| 00:00 | 02:00 | 04:00 | 06:00 | 08:00 | 10:00 | 12:00 | 14:00 | 16:00 | 18:00 | 20:00 | 22:00 | |
|---|---|---|---|---|---|---|---|---|---|---|---|---|
| 18.02.2026 | 1,53 | 1,52 | 1,57 | 1,63 | 1,56 | 1,60 | 1,50 | 1,56 | 1,50 | - | - | - |
| 17.02.2026 | 1,62 | 1,64 | 1,60 | 1,58 | 1,58 | 1,57 | 1,52 | 1,51 | 1,47 | 1,49 | 1,52 | 1,52 |
| 16.02.2026 | 1,70 | 1,66 | 1,72 | 1,61 | 1,83 | 1,65 | 1,60 | 1,56 | 1,55 | 1,54 | 1,53 | 1,60 |
| 15.02.2026 | 1,77 | 1,80 | 1,80 | 1,78 | 1,71 | 1,73 | 1,69 | 1,64 | 1,59 | 1,58 | 1,65 | 1,68 |
| 14.02.2026 | 2,08 | 2,09 | 2,02 | 1,99 | 1,95 | 1,84 | 1,85 | 1,87 | 1,76 | 1,78 | 1,77 | 1,81 |
| 13.02.2026 | 2,77 | 2,25 | 2,22 | 2,28 | 2,25 | 2,28 | 2,19 | 2,13 | 2,12 | 2,21 | 2,16 | 2,06 |
| 12.02.2026 | 1,65 | 1,72 | 1,76 | 1,79 | 1,77 | 1,69 | 1,72 | 1,71 | 1,75 | 2,68 | 4,22 | 3,71 |
| 11.02.2026 | 1,34 | 1,41 | 1,48 | 1,44 | 1,49 | 1,48 | 1,47 | 1,53 | 1,52 | 1,56 | 1,70 | 1,65 |
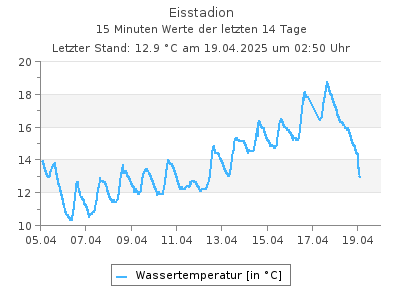
Aktuelle Wassertemperaturen als Tabelle
Letzter Tagesmittelwert (18.02.2026): 7,17 ░CWassertemperaturen in ░C im Intervall von 2 Stunden (in MEZ), Quelle: Land Berlin
| 00:00 | 02:00 | 04:00 | 06:00 | 08:00 | 10:00 | 12:00 | 14:00 | 16:00 | 18:00 | 20:00 | 22:00 | |
|---|---|---|---|---|---|---|---|---|---|---|---|---|
| 18.02.2026 | 7,10 | 7,30 | 7,40 | 7,40 | 7,40 | 7,40 | 7,60 | 7,70 | 7,70 | - | - | - |
| 17.02.2026 | 5,70 | 6,00 | 6,20 | 6,20 | 6,20 | 6,30 | 6,60 | 6,90 | 6,90 | 6,80 | 6,80 | 6,80 |
| 16.02.2026 | 6,10 | 6,20 | 6,30 | 6,10 | 6,00 | 5,90 | 6,00 | 6,10 | 6,00 | 5,80 | 5,70 | 5,50 |
| 15.02.2026 | 7,00 | 7,10 | 7,10 | 7,00 | 6,80 | 6,80 | 6,90 | 7,00 | 7,10 | 6,70 | 6,40 | 6,20 |
| 14.02.2026 | 7,40 | 7,40 | 7,50 | 7,50 | 7,40 | 7,40 | 7,60 | 7,70 | 7,60 | 7,40 | 7,30 | 7,10 |
| 13.02.2026 | 8,20 | 8,00 | 7,80 | 7,60 | 7,40 | 7,30 | 7,30 | 7,40 | 7,50 | 7,50 | 7,40 | 7,40 |
| 12.02.2026 | 8,80 | 9,00 | 8,90 | 8,80 | 8,80 | 8,90 | 9,10 | 9,30 | 9,30 | 9,20 | 8,70 | 8,30 |
| 11.02.2026 | 7,80 | 8,10 | 8,30 | 8,40 | 8,50 | 8,60 | 8,90 | 9,10 | 8,90 | 8,90 | 8,80 | 8,70 |
| Messstellennummer | 5867601 |
|---|---|
| Messstellenname | Eisstadion |
| Gewõsser | Panke |
| Betreiber | Land Berlin |
| Messstellenausprõgung | Wasserstand und Durchfluss |
| Flusskilometer | |
| Pegelnullpunkt (m +NHN) | 31.85 |
| Rechtswert (UTM 33 N) | 389447.20 |
| Hochwert (UTM 33 N) | 5822141.23 |
F³r diese Station sind keine Hauptwerte vorhanden
Als Favorit speichern Als Favorit entfernen
Durch die Liste der Durchfluss-Messstellen blõttern: